#### Usage
```csharp
CandleStickPattern(CandleStickPattern pattern, int trendStrength)
CandleStickPattern(IDataSeries input, CandleStickPattern pattern, int trendStrength)
CandleStickPattern(CandleStickPattern pattern, int trendStrength)[int barsAgo]
CandleStickPattern(IDataSeries input, CandleStickPattern pattern, int trendStrength)[int barsAgo]
```
#### Return value
**double**
0 – Pattern not existent 1 – Pattern existent
When using this method with an index (e.g. **CandleStickPattern**(...)\[**int** barsAgo] ), the value of the indicator will be outputted for the referenced bar.
#### Parameters
| | |
| ------------- | ----------------------------------------------------------------------------------------------------------------------------------------------------------------------------------------------------------------------------------------------------------------------------------------------------------------------------------------------------------------------------------------------------------------------------------------------------------------------------------------------------------------------------------------------------------------------------------------------------------------------------------------------------------------------------------------------------------------------------------------------------------------------------------------------------------------------------------------------------------------------------------------------------------------------------------------------------------------------------------------------------------------- |
| InSeries | Input data series for the indicator |
| pattern | Possible values are:
CandleStickPattern.BearishBeltHold,
CandleStickPattern.BearishEngulfing,
CandleStickPattern.BearishHarami,
CandleStickPattern.BearishHaramiCross,
CandleStickPattern.BullishBeltHold,
CandleStickPattern.BullishEngulfing,
CandleStickPattern.BullishHarami,
CandleStickPattern.BullishHaramiCross,
CandleStickPattern.DarkCloudCover,
CandleStickPattern.Doji,
CandleStickPattern.DownsideTasukiGap,
CandleStickPattern.EveningStar,
CandleStickPattern.FallingThreeMethods,
CandleStickPattern.Hammer,
CandleStickPattern.HangingMan,
CandleStickPattern.InvertedHammer,
CandleStickPattern.MorningStart,
CandleStickPattern.PiercingLine,
CandleStickPattern.RisingThreeMethods,
CandleStickPattern.ShootingStar,
CandleStickPattern.StickSandwich,
CandleStickPattern.ThreeBlackCrows,
CandleStickPattern.ThreeWhiteSoldiers,
CandleStickPattern.UpsideGapTwoCrows,
CandleStickPattern.UpsideTasukiGap
|
| trendStrength | Signifies the number of bars to the left and right of the swing high or swing low that are used to identify a trend. The value 0 turns off the search, meaning that the only thing searched for is chart patterns. |
#### Visualization
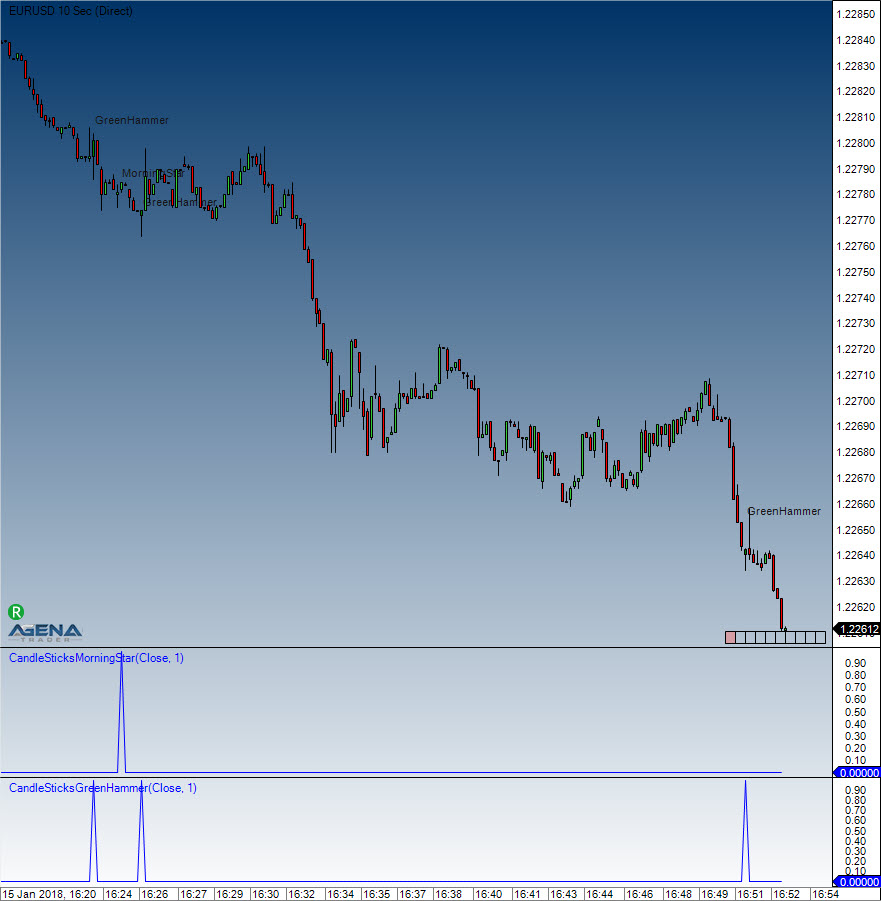
#### Example
```csharp
if (CandelStickPattern(CandleStickPattern.ShootingStar, 5)[0] == 1)
Print("Pattern ShootingStar found!");
```
# ChaikinMoneyFlow (CMF)
#### Description
Marc Chaikin was the one to develop the Chaikin Money Flow Index, which is a volume indicator that tries to find an answer to the following question: Where is the money flowing into? Into the stock = accumulation, and out of the stock = distribution. Clearly, this applies not only to stocks/shares but also to other instruments. With this, Chaikin attempts to expand on and improve the On-Balance Volume that was developed by Granville. Using the CMF, the position of the closing price within the trading range is placed in relation to the volume. What this essentially means is that the trading volume is multiplied by the price. The trading volume displays the amount of money that has “flowed” into the stock or has been “removed” from the stock; the indicator simply displays whether it has been accumulated (buying pressure) or removed (distribution).
#### Interpretation
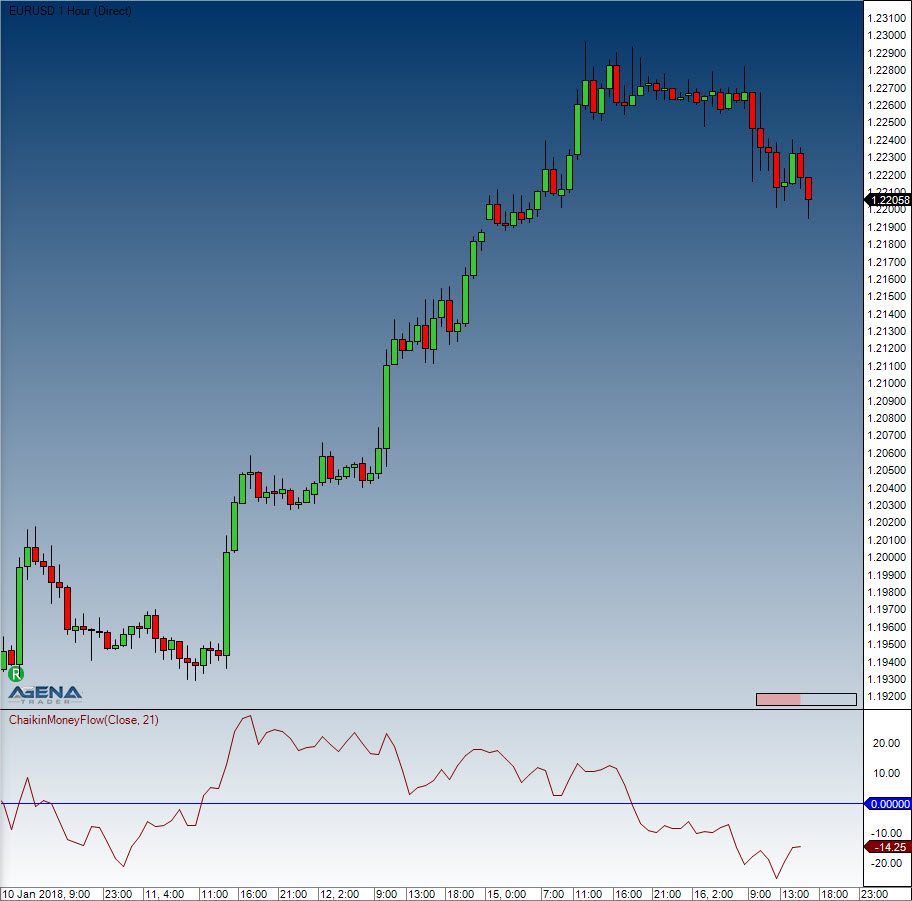
The CMF oscillates around the zero line and is shown in a separate window with an open scale. Should the CMF be located above the zero line, then it can be interpreted as accumulation. If higher highs are being created, then the buying pressure is increasing. The reverse is true for the selling pressure. The Chaikin Money Flow should always be used in combination with other methods of technical analysis.
#### Further information
VTAD:
#### Usage
```csharp
ChaikinMoneyFlow(int period)
ChaikinMoneyFlow(IDataSeries inSeries, int period)
ChaikinMoneyFlow(int period)[int barsAgo]
ChaikinMoneyFlow(IDataSeries inSeries, int period)[int barsAgo]
```
#### Return value
**double**
When using this method with an index (e.g. **ChaikinMoneyFlow**(21)\[**int** barsAgo] ), the value of the indicator will be outputted for the referenced bar.
#### Parameters
inSeries Input data series for the indicator
period Number of bars included in the calculation
#### Visualization
#### Example
```csharp
//Output for the Money Flow value
Print("The Chaikin Money Flow value is: " + ChaikinMoneyFlow(21)[0]);
```
# Chaikin Oscillator
#### Description
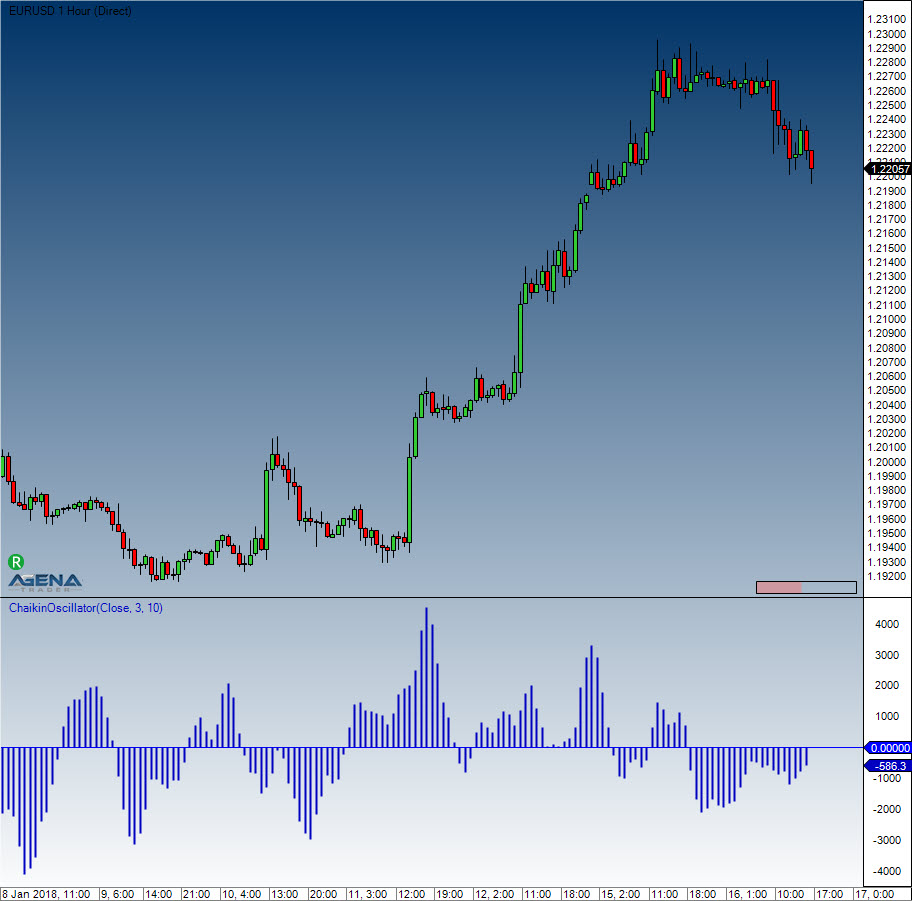
The Chaikin Oscillator is a volume indicator that lets the trader know whether new highs are also accompanied by new volumes. This oscillator is a simple MACD that is applied to the accumulation/distribution line. Hereby, the difference between a 3-day exponential moving average and a 10-day exponential smoothed average for the accumulation/distribution line is calculated.
#### Interpretation
The interpretation of the Chaikin Oscillator is similar to the principle of the accumulation/distribution. All an oscillator does is show the changes in liquidity for the instrument.
#### Usage
```csharp
ChaikinOscillator(int fast, int slow)
ChaikinOscillator(IDataSeries inSeries, int fast, int slow)
ChaikinOscillator(int fast, int slow)[int barsAgo]
ChaikinOscillator(IDataSeries inSeries, int fast, int slow)[int barsAgo]
```
#### Return value
**double**
When using this method with an index (e.g. **ChaikinOscillator**(3, 10)\[**int** barsAgo] ), the value of the indicator will be outputted for the referenced bar.
#### Parameters
inSeries Input data series for the indicator
fast Number of bars included in the calculation for the fast EMA
slow Number of bars included in the calculation for the slow EMA
#### Visualization
#### Example
```csharp
//Output for the oscillator for the fast and slow values of 3 and 10
Print("The Chaikin Oscillator value is: " + ChaikinOscillator(3, 10)[0]);
```
# ChaikinVolatility (CVL)
#### Description
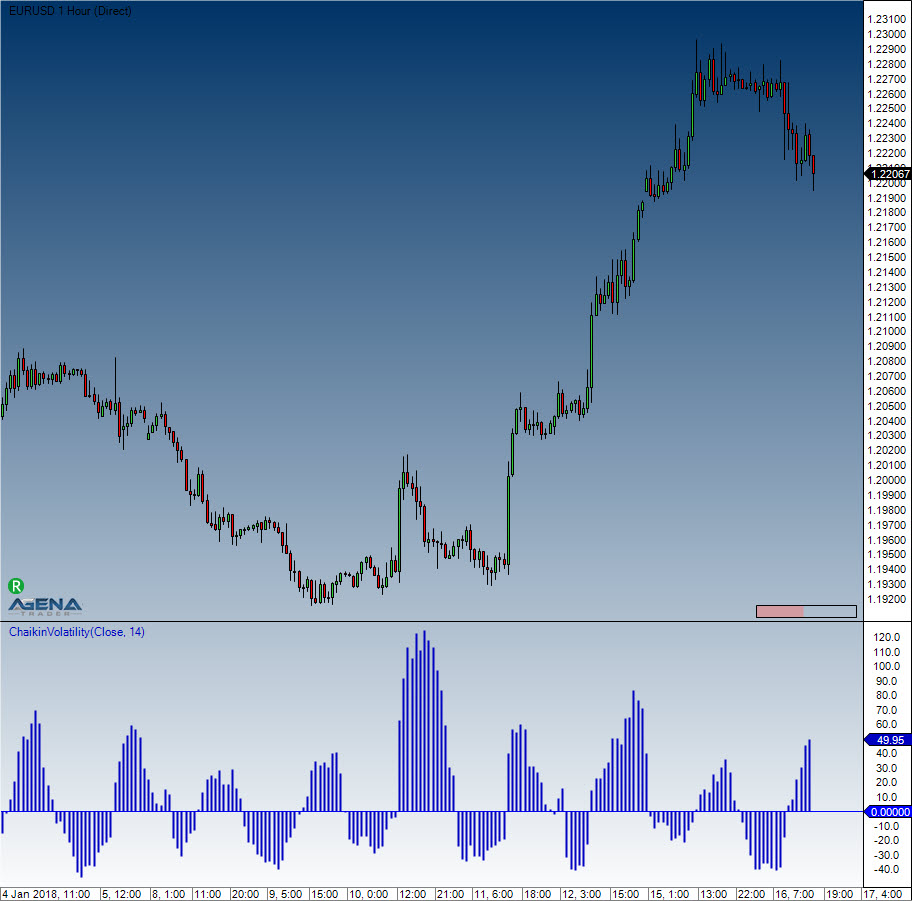
The Chaikin Volatility Indicator is one of a few indicators that are designed to try and measure price movement fluctuations. Chaikin takes the daily price range (daily high minus daily low) as the fundamental measure of volatility. With this indicator, a widening range is, by implication, associated with a higher volatility.
#### Interpretation
The indicator oscillates around the zero line and fluctuates between a scale of +100 to -100. It can be used on a daily chart as well as on a weekly or monthly chart. All values above the zero line represent rising volatility, and the gradient of the rise implies the seriousness of potential floors forming. The Chaikin Volatility is not specifically used to define exact signals, but is considered as more of an assisting tool in the trading system.
#### Usage
```csharp
ChaikinVolatility(int fast, int slow)
ChaikinVolatility(IDataSeries inSeries, int fast, int slow)
ChaikinVolatility(int fast, int slow)[int barsAgo]
ChaikinVolatility(IDataSeries inSeries, int fast, int slow)[int barsAgo]
```
#### Return value
**double**
When using this method with an index (e.g. **ChaikinVolatility**(14)\[**int** barsAgo] ), the value of the indicator will be outputted for the referenced bar.
#### Parameters
inSeries Input data series for the indicator
period Number of bars included in the calculations
#### Visualization
#### Example
```csharp
//Chaikin output for a period of 14
Print("The value of the Chaikin Volatility is: " + ChaikinVolatility(14)[0]);
```
# Chande Momentum Oscillator (CMO)
#### Description
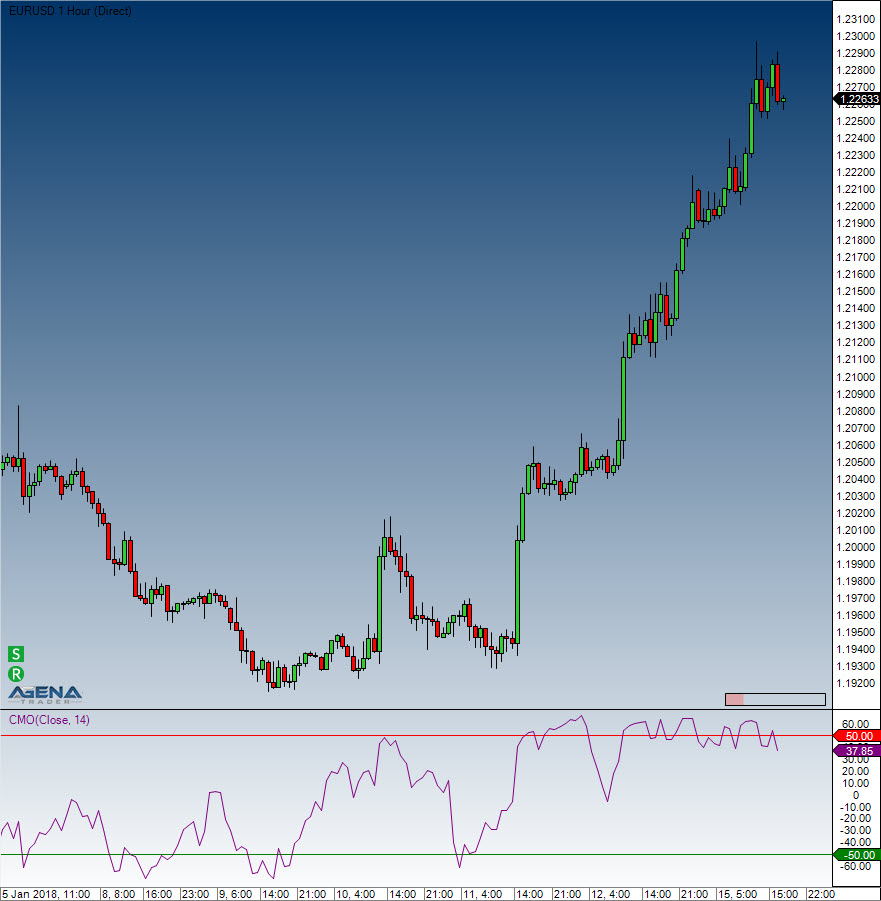
The CMO is one of several indicators created by the technical analyst Tushar Chande; it is a technical momentum indicator. This indicator arises from calculating the difference between the total of all recent gains and the total of all recent losses, and then dividing this result by the total of all price movement over the given period. This oscillator shares similarities with other momentum indicators such as the Relative Strength Index and the Stochastic Oscillator, because it is also range-bound (+100 and -100).
#### Interpretation
**The security is deemed overbought when the momentum oscillator is above +50 and oversold when it is below -50. Many technical traders add a nine-period moving average to this oscillator to act as a signal line. Bullish signals are generated when the oscillator crosses above the signal, and bearish signals are generated when the oscillator crosses down through the signal.**
#### Further information
#### Usage
```csharp
CMO(int period)
CMO(IDataSeries inSeries, int period)
CMO(int period)[int barsAgo]
CMO(IDataSeries inSeries, int period)[int barsAgo]
```
#### Return value
**double**
When using this method with an index (e.g. **CMO**(14)\[**int** barsAgo] ), the value of the indicator will be issued for the referenced bar.
#### Parameters
inSeries Input data series for the indicator
period Number of bars included in the calculations
#### Visualization
#### Example
```csharp
//Output for the value of the Chande Momentum Oscillator
Print("The current value for the Chande Momentum Oscillator is: " + CMO(14)[0]);
```
# Climactic Distance
#### Description
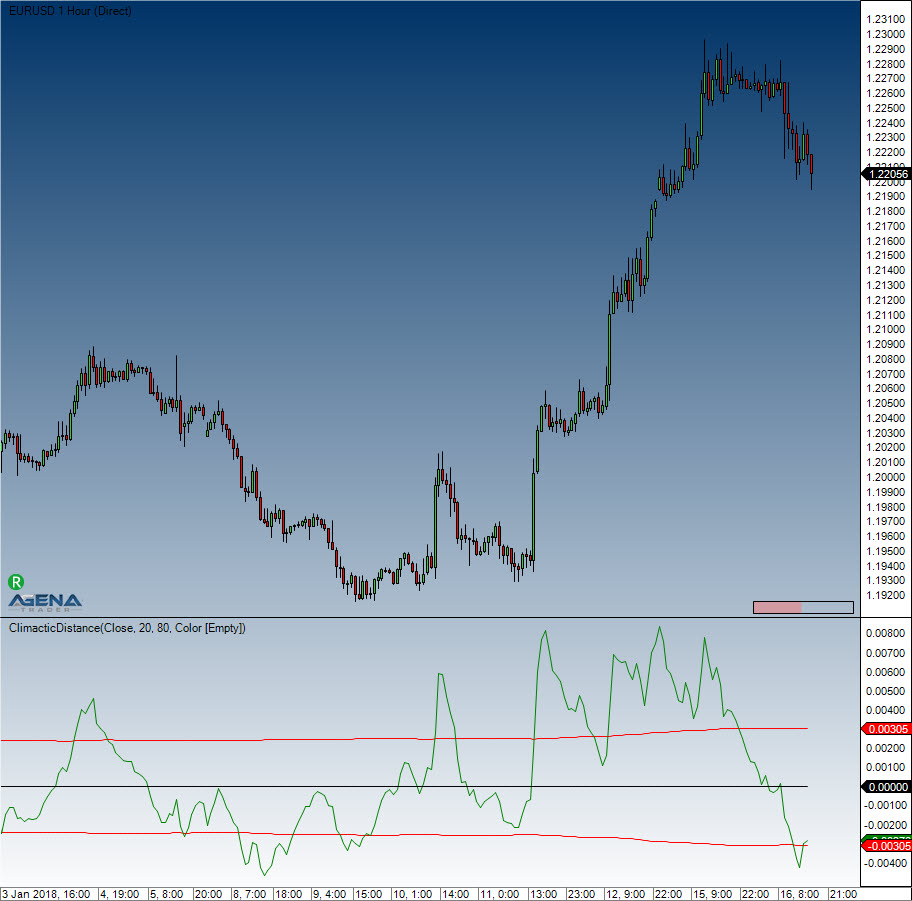
The Climactic Distance indicator was invented and developed by Gilbert Kreuzthaler, CEO of Include IT GmbH and founder of AgenaTrader.com. This indicator is used in the Location Point Trading system. It calculates the median course of the current and historical candle at a distance to the simple moving average (SMA) of the last 20 periods. Additionally, it also measures the average course deviation within the last 80 periods. If the median course exceeds the top or bottom course deviation, the market is deemed climactic, and this influences the trading decisions made in Location Point Trading.
#### Calcualtion
Black line in the middle: SMA 20 Green moving line: Median Kurs Red upper and lower line: Average course deviation oft he last 80 periods.
#### More information
#### Usage
```csharp
ClimacticDistance(int sMAPeriod, int thresholdPercent)
ClimacticDistance(IDataSeries InSeries, int sMAPeriod, int thresholdPercent)
ClimacticDistance(int period, int tresholdPercent, Color climacticColor)
ClimacticDistance(IDataSeries InSeries, int sMAPeriod, int thresholdPercent, Color climacticColor)
//Upper band
ClimacticDistance(int sMAPeriod, int thresholdPercent).Upper[int barsAgo]
ClimacticDistance(IDataSeries InSeries, int sMAPeriod, int thresholdPercent).Upper[int barsAgo]
ClimacticDistance(int period, int tresholdPercent, Color climacticColor).Upper[int barsAgo]
ClimacticDistance(IDataSeries InSeries, int sMAPeriod, int thresholdPercent, Color climacticColor).Upper[int barsAgo]
//Lower band
ClimacticDistance(int sMAPeriod, int thresholdPercent).Lower[int barsAgo]
ClimacticDistance(IDataSeries InSeries, int sMAPeriod, int thresholdPercent).Lower[int barsAgo]
ClimacticDistance(int period, int tresholdPercent, Color climacticColor).Lower[int barsAgo]
ClimacticDistance(IDataSeries InSeries, int sMAPeriod, int thresholdPercent, Color climacticColor).Lower[int barsAgo]
//MovingAverage
ClimacticDistance(int sMAPeriod, int thresholdPercent).MovingAverage[int barsAgo]
ClimacticDistance(IDataSeries InSeries, int sMAPeriod, int thresholdPercent).MovingAverage[int barsAgo]
ClimacticDistance(int period, int tresholdPercent, Color climacticColor).MovingAverage[int barsAgo]
ClimacticDistance(IDataSeries InSeries, int sMAPeriod, int thresholdPercent, Color climacticColor).MovingAverage[int barsAgo]
//Distance
ClimacticDistance(int sMAPeriod, int thresholdPercent).Distance[int barsAgo]
ClimacticDistance(IDataSeries InSeries, int sMAPeriod, int thresholdPercent).Distance[int barsAgo]
ClimacticDistance(int period, int tresholdPercent, Color climacticColor).Distance[int barsAgo]
ClimacticDistance(IDataSeries InSeries, int sMAPeriod, int thresholdPercent, Color climacticColor).Distance[int barsAgo]
```
#### Return value
**double**
#### Parameters
Int
#### Visualization
#### Example
```csharp
//Output of the value for the Upper climactic distance line
Print(“Value of the upper band: “ + ClimacticDistnance(20, 80).Upper[0]);
//Output of the value for the Lower climactic distance line
Print(“Value of the upper band: “ + ClimacticDistnance(20, 80).Lower[0]);
//Output of the value for the Distance climactic distance line
Print(“Value of the upper band: “ + ClimacticDistnance(20, 80).Distance[0]);
//Output of the value for the Moving Average climactic distance line
Print(“Value of the upper band: “ + ClimacticDistnance(20, 80).MovingAverage[0]);
```
# Commodity Channel Index (CCI)
#### Description
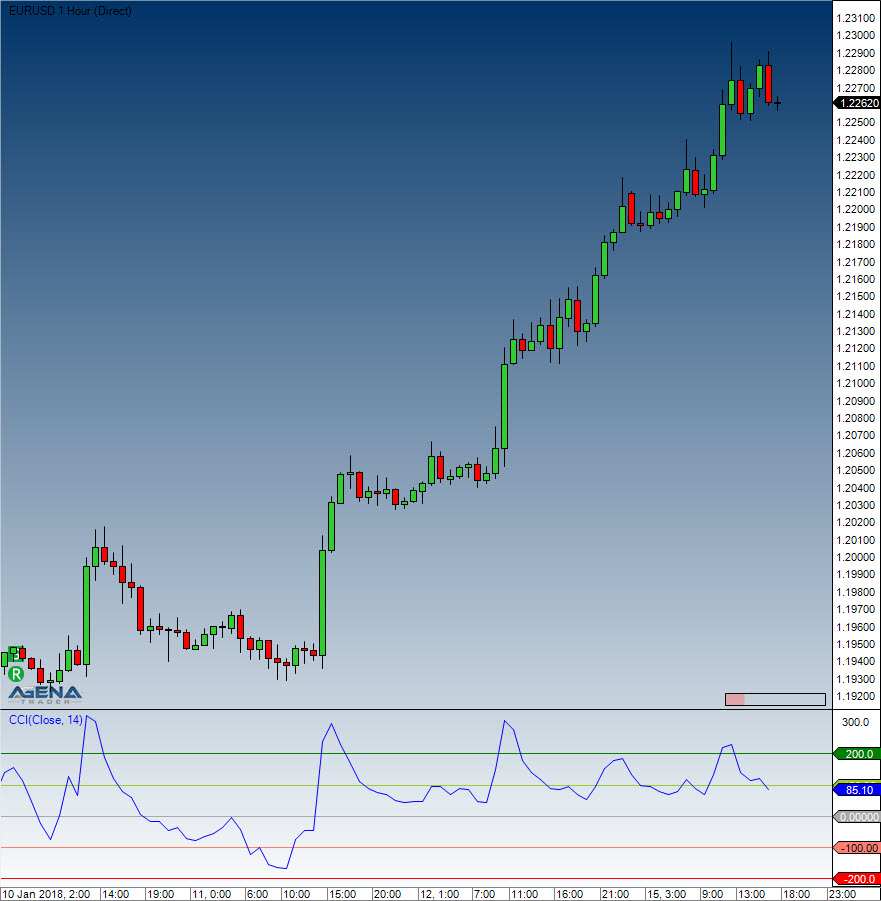
The Commodity Channel Index (CCI), which was created by Donald Lambert and actually featured in Commodities magazine in 1980, is a versatile indicator that can be used for identifying a new trend or as a warning of extreme conditions. Lambert originally developed the CCI as a means to identify cyclical turns in commodities – however, the indicator can also successfully be applied to ETFs, indices, stocks and various other securities. In general, what CCI does is to measure the current price level relative to an average price level over a specified period of time. When prices are well above their average, CCI is relatively high. When prices are far below their average, CCI is relatively low. This is how CCI can be used for identifying overbought and oversold levels.
#### Interpretation
CCI measures the difference between a securitys price change and its average price change. High positive readings indicate that prices are well above their average, which is a show of strength. Low negative readings indicate that prices are well below their average, which is a show of weakness.
The Commodity Channel Index (CCI) can be used as either a coincident or leading indicator. As a coincident indicator, surges above +100 reflect strong price action that can signal the start of an uptrend. Plunges below -100 reflect weak price action that can signal the start of a downtrend.
As a *leading indicator*, *momentum oscillators*, chartists can look for overbought or oversold conditions that may foreshadow a mean reversion. Similarly, bullish and bearish divergences can be used to detect early momentum shifts and anticipate trend reversals.
#### Further information
VTAD:
#### Usage
```csharp
CCI(int period)
CCI(IDataSeries inSeries, int period)
CCI(int period)[int barsAgo]
CCI(IDataSeries inSeries, int period)[int barsAgo]
```
#### Return value
**double**
When using this method with an index (e.g. **CCI**(14)\[**int** barsAgo] ), the value of the indicator will be issued for the referenced bar.
#### Parameters
inSeries Input data series for the indicator
period Number of bars included in the calculations
#### Visualization
#### Example
```csharp
//Output for the CCI value calculated using 14 periods
Print("The value of the Commodity Channel Index is: " + CCI(14));
```
# Directional Movement (DM)
#### Description
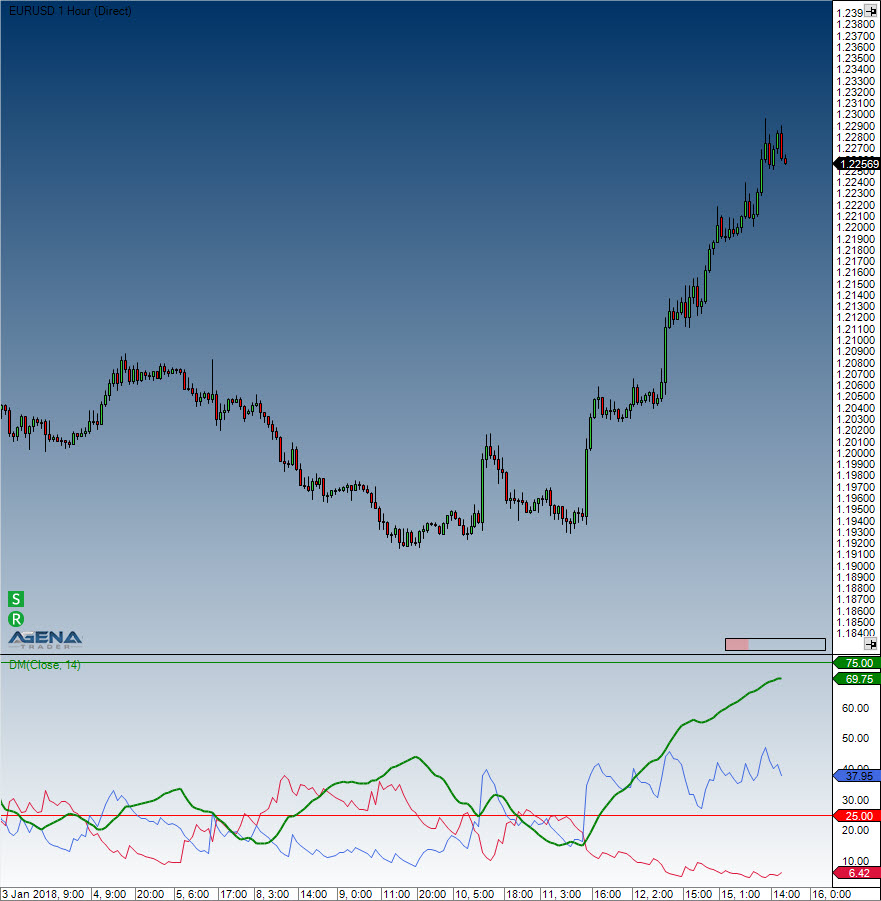
The Directional Movement indicator is almost identical to the ADX, with the only difference that the +DM and -DM values are also calculated. These values are then later on used for the DMI.
#### Interpretation
The Directional Movement indicator is positive when the difference between the highs is at its largest.
#### Further information
See: Directional Movement Index ([*DMI*](/standard-indicators/directional-movement-index-dmi))
#### Usage
```csharp
DM(int period)
DM(IDataSeries inSeries, int period)
DM(int period)[int barsAgo]
DM(IDataSeries inSeries, int period)[int barsAgo]
//For the value of +DM
DM(int period).DiPlus[int barsAgo]
DM(IDataSeries inSeries, int period).DiPlus[int barsAgo]
//For the value of -DM
DM(int period).DiMinus[int barsAgo]
DM(IDataSeries inSeries, int period).DiMinus[int barsAgo]
```
#### Return value
**double**
When using this method with an index (e.g. **DM**(14).DiPlus\[**int** barsAgo] ), the value of the indicator will be issued for the referenced bar.
#### Parameters
inSeries Input data series for the indicator
period Number of bars included in the calculations
#### Visualization
#### Example
```csharp
//Output of the DM values
Print("The current +DM value is: " + DM(14).DiPlus[0]);
Print("The current –DM value is: " + DM(14).DiMinus[0]);
```
# Donchian Channel
#### Description
The Donchian channel can also be called the “4-week-rule”; this is how it works: when the current price reaches a peak above the high of the past 4 weeks, a new long position is opened. If a short position is open simultaneously, it is closed. This works vice versa with shorts. The Donchian channel trading system is a purely trend-following system based on the concept “buy when it is strong, sell when it is weak”. The famous “Turtles” also employed this breakout system. This indicator displays the highs and lows of the last n days as lines above and below the price development. 20 days represent 4 weeks.
#### Further information
VTAD:
#### Usage
```csharp
DonchianChannel(int period)
DonchianChannel(IDataSeries inSeries, int period)
//Upper band
DonchianChannel(int period).Upper[int barsAgo]
DonchianChannel(IDataSeries inSeries, int period).Upper[int barsAgo]
//Middle band
DonchianChannel(int period)[int barsAgo]
DonchianChannel(IDataSeries inSeries, int period)[int barsAgo]
//Lower band
DonchianChannel(int period).Lower[int barsAgo]
DonchianChannel(IDataSeries inSeries, int period).Lower[int barsAgo]
```
#### Return value
**double**
When using this method with an index (e.g. **DonchianChannel**(14)\[**int** barsAgo] ), the value of the indicator will be issued for the referenced bar.
#### Parameters
inSeries Input data series for the indicator
period Number of bars included in the calculations
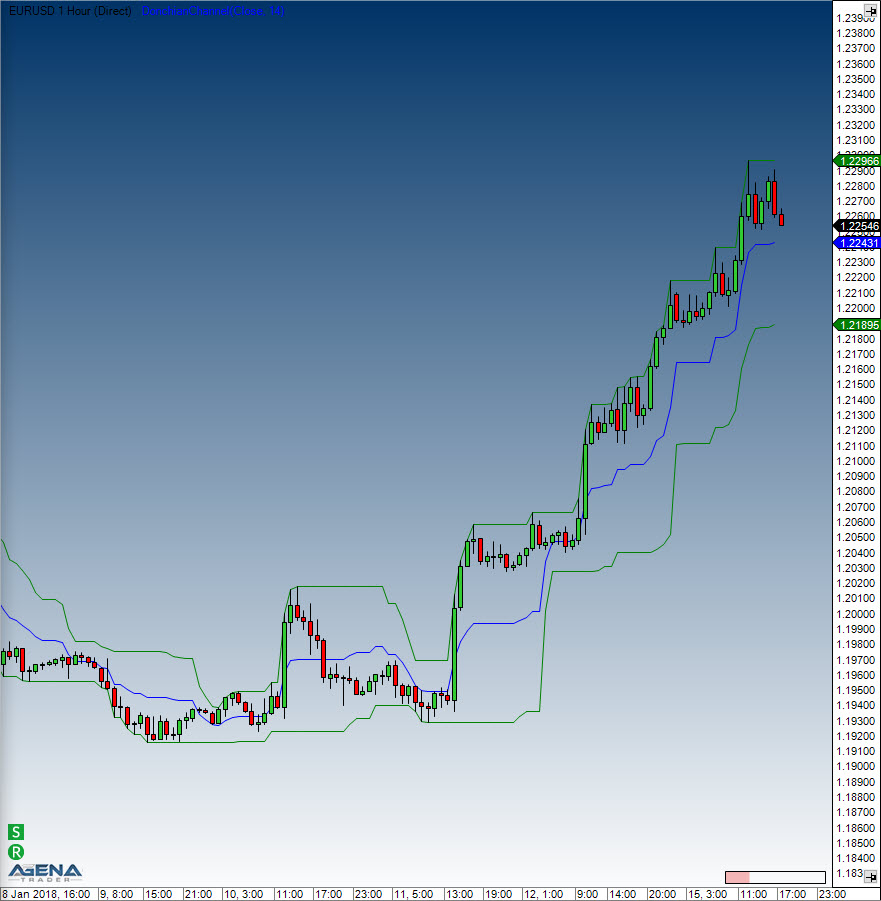
#### Visualization
#### Example
```csharp
//Output for the values of the Donchian Channel
Print("The upper band is at: " + DonchianChannel(14).Upper[0]);
Print("The middle band is at: " + DonchianChannel(14)[0]);
Print("The lower band is at: " + DonchianChannel(14).Lower[0]);
```
# Directional Movement Index (DMI)
#### Description
Welles Wilder Jr. developed the Directional Movement concept in 1978. His concept includes the following components:
Directional Movement Index (DMI)
Average Directional Movement Index ([*ADX*](/standard-indicators/average-directional-index-adx))
True Range (TR)
The Directional Movement Index comes before the Average Directional Movement Index. The DMI shows the strengths of the trend-favoring price movements in percentages. Its standard application is the smoothed ADX.
#### Interpretation
The DMI shows the strength of the trend, but not the trend direction. This means that it is particularly suited as a filter for trading systems employing the Parabolic SAR, for example, in order to filter out sideways phases. When the DMI rises (especially above 25), a trend is displayed; anything below that is recognized as a sideways phase. The +DI and the –DI point towards a trend. An uptrend is classified when the +DI is above the –DI. The further apart they drift, the stronger the trend.
#### Further information
VTAD:
#### Usage
```csharp
DMI(int period)
DMI(IDataSeries inSeries, int period)
DMI(int period)[int barsAgo]
DMI(IDataSeries inSeries, int period)[int barsAgo]
```
#### Return value
**double**
When using this method with an index (e.g. **DMI**(20)\[**int** barsAgo] ), the value of the indicator will be issued for the referenced bar.
#### Parameters
inSeries Input data series for the indicator
period Number of bars included in the calculations
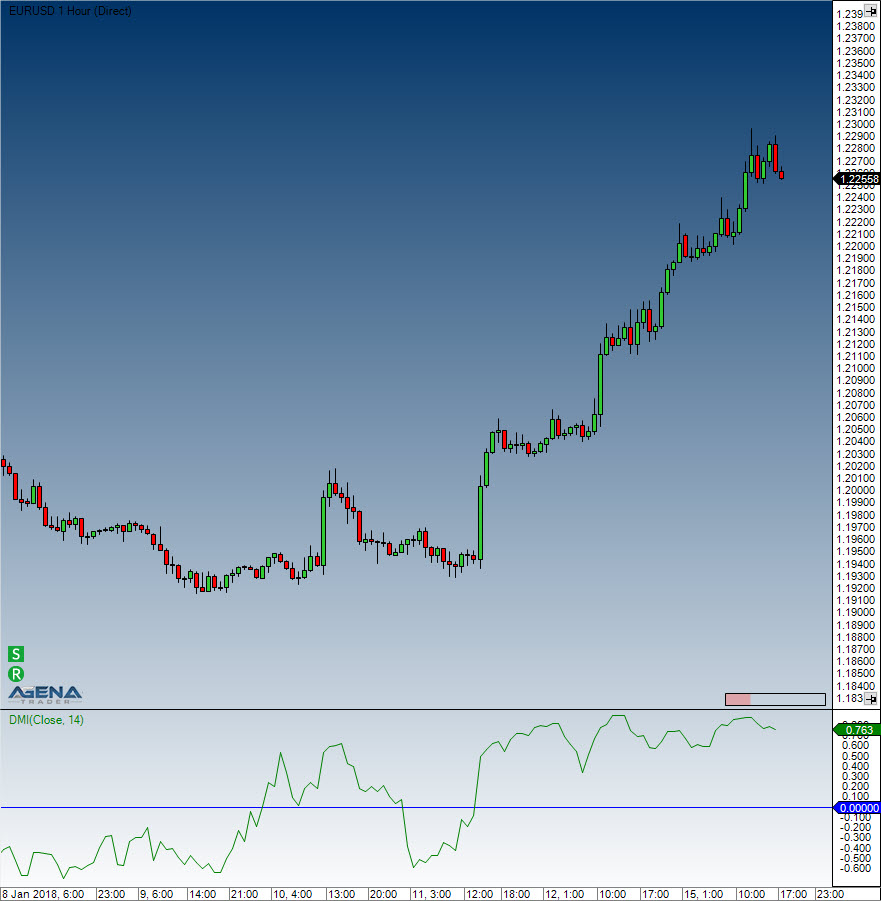
#### Visualization
#### Example
```csharp
//Output for the DMI
Print("The current DMI value is: " + DMI(20)[0]);
```
# Double Stochastics (DSS)
#### Description
William Blau was the developer of the Double Smoothed Stochastic (DSS), which is a double-smoothed stochastic indicator. After a while, it was improved upon by Walter Bressert as a variation of the double-smoothed stochastic. Smaller changes in the price movements cause this indicator to react more sensitively, and it also produces more signals than the one Blau developed. The Bressert version therefore also illustrates extreme zones more clearly than the Blau version.
Regardless of the various calculation methods used, the DSS always stays within a scale of 0 to 100. The extreme zones in the developed stochastics are the same as for the original stochastics. The upper extreme area is marked at 80, and the lower extreme zone at 20 - these values cannot be changed. For many applications, it is wise to include an additional middle line at 50, and to adapt this to the circumstances as needed.
#### Interpretation
Values above 80 are seen as overbought, and below 20 as oversold. In addition, signals are produced by the signal line’s behavior and movements into and out of the extreme zones.
#### Usage
```csharp
DoubleStochastics(int period)
DoubleStochastics(int period)[int barsAgo]
DoubleStochastics(int period, DoubleStochasticsMode mode, int EMA-Period1)
DoubleStochastics(IDataSeries inSeries, int period, DoubleStochasticsMode mode, int EMA-Period1)
DoubleStochastics(int period, DoubleStochasticsMode mode, int EMA-Period1)[int barsAgo]
DoubleStochastics(IDataSeries inSeries, int period, DoubleStochasticsMode mode, int EMA-Period1)[int barsAgo]
DoubleStochastics(int period, DoubleStochasticsMode mode, int EMA-Period1, int EMA-Period2)
DoubleStochastics(IDataSeries inSeries, int period, DoubleStochasticsMode mode, int EMA-Period1, int EMA-Period2)
DoubleStochastics(int period, DoubleStochasticsMode mode, int EMA-Period1, int EMA-Period2)[int barsAgo]
DoubleStochastics(IDataSeries inSeries, int period, DoubleStochasticsMode mode, int EMA-Period1, int EMA-Period2)[int barsAgo]
//For the value of %K
DoubleStochastics(int period).K[int barsAgo]
DoubleStochastics(IDataSeries inSeries, int period).K[int barsAgo]
DoubleStochastics(int period, DoubleStochasticsMode mode, int EMA-Period1).K[int barsAgo]
DoubleStochastics(IDataSeries inSeries, int period, DoubleStochasticsMode mode, int EMA-Period1).K[int barsAgo]
DoubleStochastics(int period, DoubleStochasticsMode mode, int EMA-Period1, int EMA-Period2).K[int barsAgo]
DoubleStochastics(IDataSeries inSeries, int period, DoubleStochasticsMode mode, int EMA-Period1, int EMA-Period2).K[int barsAgo]
```
#### Return value
**double**
When using this method with an index (e.g. **DoubleStochastics**(...)\[**int** barsAgo] or **DoubleStochastics**(...).K\[**int** barsAgo]), the value of the indicator will be issued for the referenced bar.
#### Parameters
inSeries Input data series for the indicator
period Number of bars included in the calculations (default: 10)
mode Method of calculation, possible inSeries are Blau, Blau2, Bressert
EMA-Period1 Periods for the EMA
EMA-Period2 Periods for the second EMA
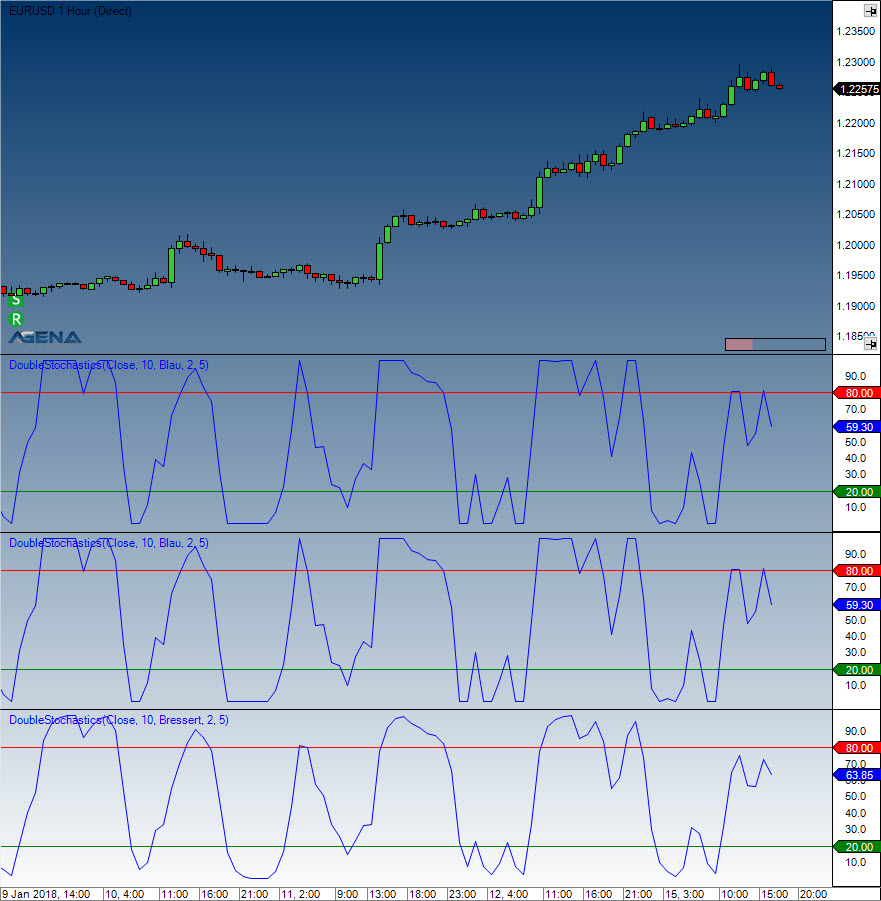
#### Visualization
#### Example
```csharp
//Output for %K
Print("The value of the DSS Bressert %K is: " + DoubleStochastics(10, DoubleStochasticsMode.Bressert, 2)[0]);
```
# Dynamic Momentum Index (DMIndex)
#### Description
The Dynamic Momentum Index, which was developed by Tushar Chande, is a specific variant of the Relative Strength Index. Chande changed the Dynamic Momentum Index in such a way that, based on various factors, the period settings automatically adjust themselves, which he achieved by coupling it to the RSI in order for a volatility component to be present. The definition of this volatility component is based on a 5-day standard deviation of the closing prices. This, in turn, is then compared to the 10-day average of a 5-day standard deviation.
#### Interpretation
If the Dynamic Momentum Index is showing the overbought area, one speculates on falling prices; if the Dynamic Momentum Index is showing the oversold area, the speculation is on rising prices. Trading in this way makes sense if other indicators such as absCMO are showing a trendless phase, so the point is to trade against the trend. During a strong trend phase, it is recommended to trade in the trend direction; in the phase of an upward trend, one should wait for an oversold situation until a buy signal occurs.
#### Further and more concise information
VTAD:
#### Usage
```csharp
DMIndex(int smooth)
DMIndex(IDataSeries inSeries, int smooth)
DMIndex(int smooth)[int barsAgo]
DMIndex(IDataSeries inSeries, int smooth)[int barsAgo]
```
#### Return value
**double**
When using this method with an index (e.g. **DMIndex**(3)\[**int** barsAgo] ), the value of the indicator will be issued for the referenced bar.
#### Parameters
inSeries Input data series for the indicator
smooth Smoothing settings
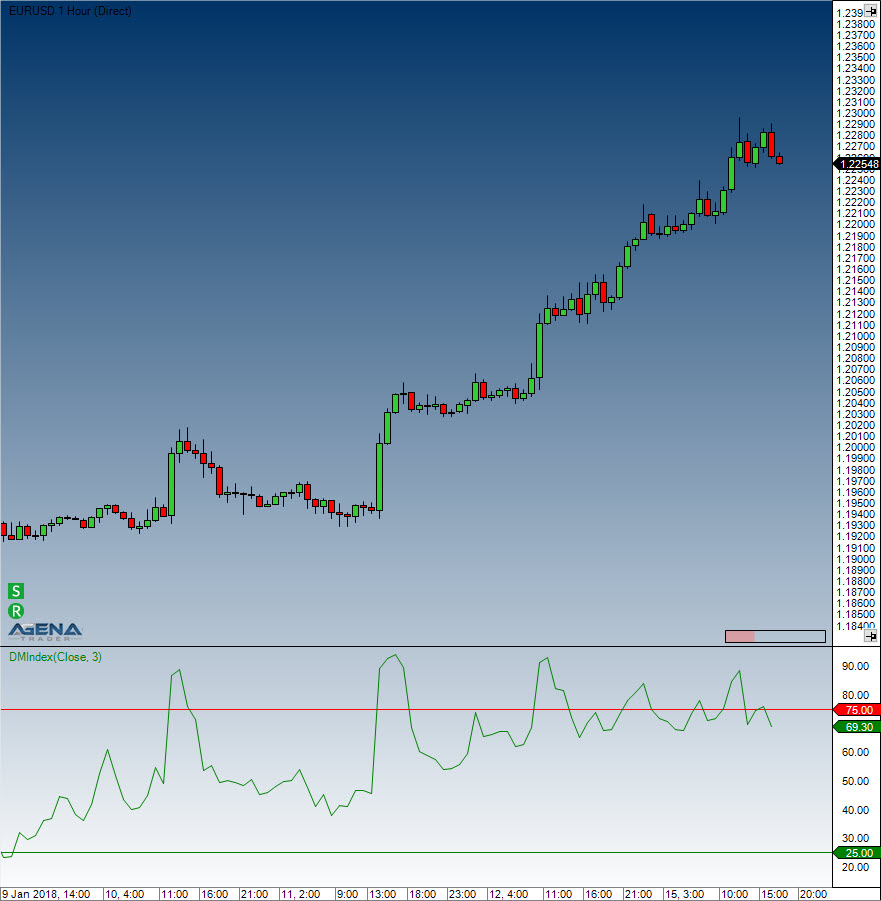
#### Visualization
#### Example
```csharp
//Output of the value for the DMIndex Indicator with a smoothing factor of 3
Print("The current value for the DMIndex is: " + DMIndex(3)[0]);
```
# Ease of Movement (EOM)
#### Description
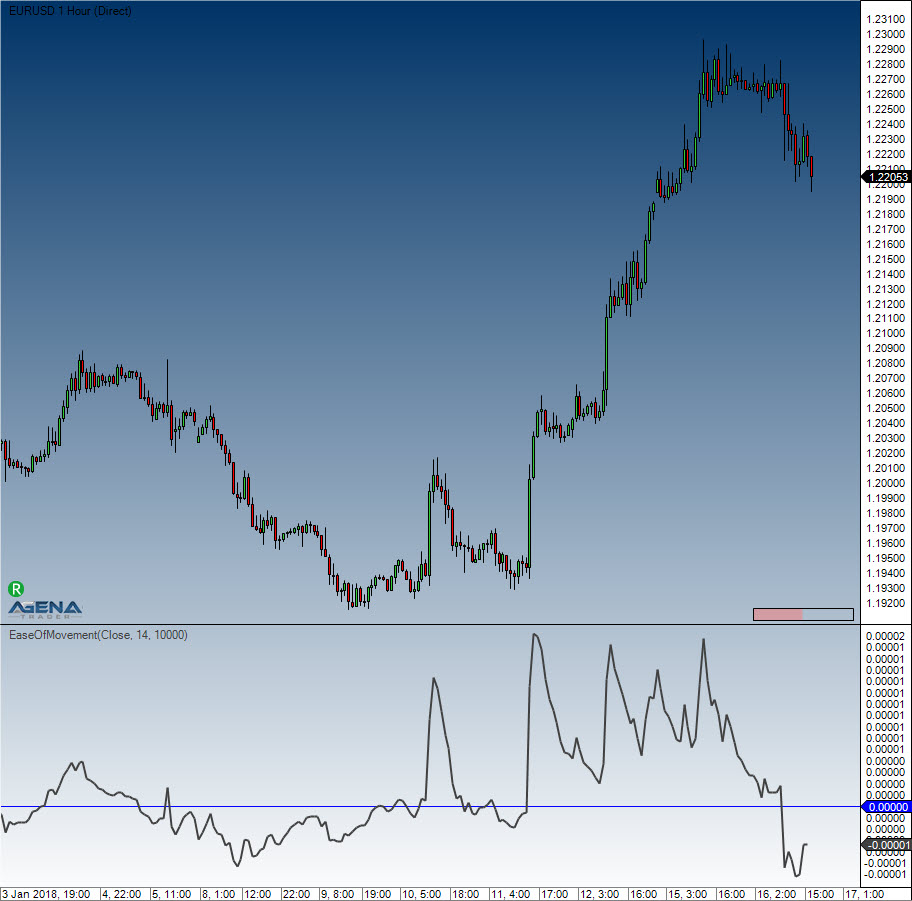
Ease of Movement (EMV) is a volume-based oscillator created by Richard Arms that constantly moves above and below the zero line. It is intended to measure the "ease" of price movement, as suggested by the name. Arms developed Equivolume charts in order to visually display price ranges and volume. Ease of Movement expands upon Equivolume by quantifying the price/volume relationship and displaying the results in the form of an oscillator. Generally, when the oscillator is in a positive area, prices are advancing with relative ease. On the other hand, when the oscillator is in negative territory, prices are falling with relative ease.
#### Interpretation
When the EOM is moving away from the zero line (marker) then an impulse has begun in that direction. During a breakout onto the opposite side of the zero line, it is recommended to enter with the trend direction.
#### Further information
[http://www.volumen-analyse.de](http://www.volumen-analyse.de/)
#### Usage
```csharp
EaseOfMovement(int smoothing, int volDivisor)
EaseOfMovement(IDataSeries inSeries, int smoothing, int volDivisor)
EaseOfMovement(int smoothing, int volDivisor)[int barsAgo]
EaseOfMovement(IDataSeries inSeries, int smoothing, int volDivisor)[int barsAgo]
```
#### Return value
**double**
When using this method with an index (e.g. **EaseOfMovement**(14, 10000)\[**int** barsAgo] ), the value of the indicator will be issued for the referenced bar.
#### Parameters
inSeries Input data series for the indicator
smoothing Smoothing settings
volDivisor For calculation of the box ratio (see “Calculation” below)
#### Visualization
#### Calculation
Midpoint = (High + Low) / 2 MidpointMove = Midpoint \[today] – Midpoint \[yesterday] BoxRatio = Volume / (High – Low) Ease = MidpointMove / Box Ratio
#### Example
```csharp
//Output for the values of the EOM line
Print("The value for the Ease of Movement is: " + EaseOfMovement(14, 10000)[0]);
```
# Fisher Transform
### Fisher Transform
#### Description
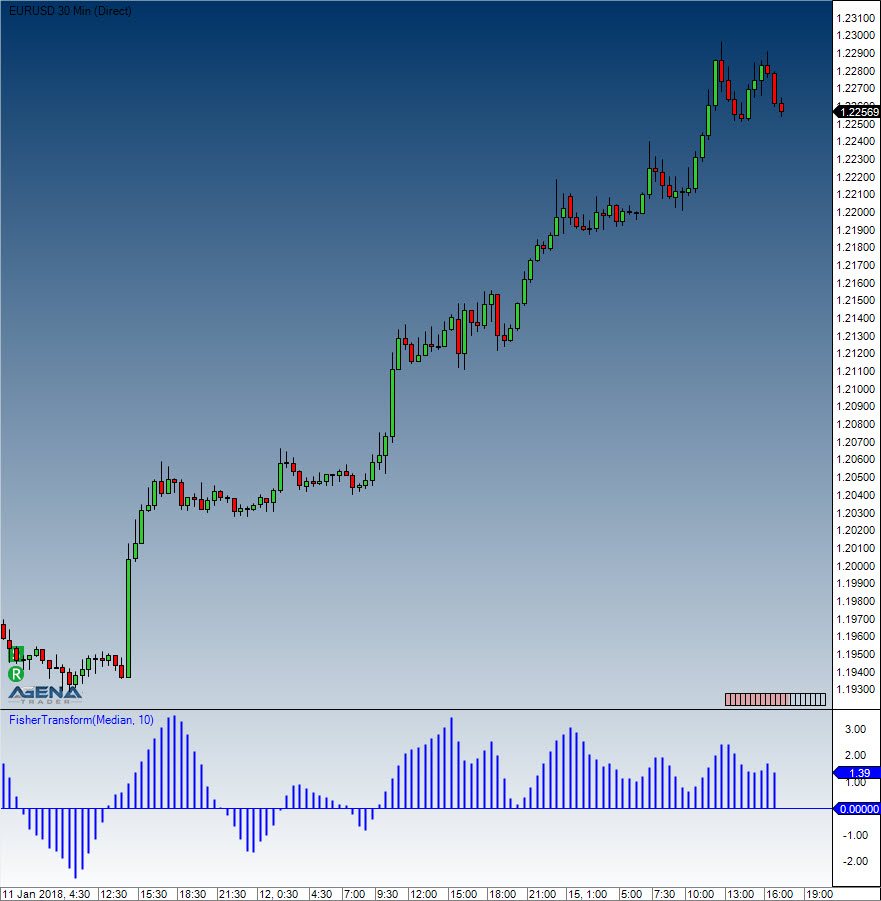
The physicist John Ehlers created the Fisher Transform in 2002. The intention of the indicator is to show where there are turning points, which can be achieved with the help of the Inverse Fisher Transform. This changes indicators in such a way that the movements are less random, and the signal quality is clearer. The Fisher Transform either stretches or compresses the input values of the function so that the output is very likely to be between -1 and 1. This gives us a clearly identifiable pattern where even indicators such as the RSI become better defined and more precise.
#### Interpretation
A system using the Fisher Transform can be found here:
#### Parameters
inSeries Input data series for the indicator
period Number of bars included in the calculations
#### Return value
**double**
When using this method with an index (e.g. **FisherTransform**(10)\[**int** barsAgo] ), the value of the indicator will be issued for the referenced bar.
#### Usage
```csharp
FisherTransform(int period)
FisherTransform(IDataSeries inSeries, int period)
FisherTransform(int period)[int barsAgo]
FisherTransform(IDataSeries inSeries, int period)[int barsAgo]
```
#### Visualization
#### Example
```csharp
//Output values for the Fisher Transform
Print("The current value for the Fisher Transform is: " + FisherTransform(10)[0]);
```
# Forecast Oscillator (FOSC)
#### Description
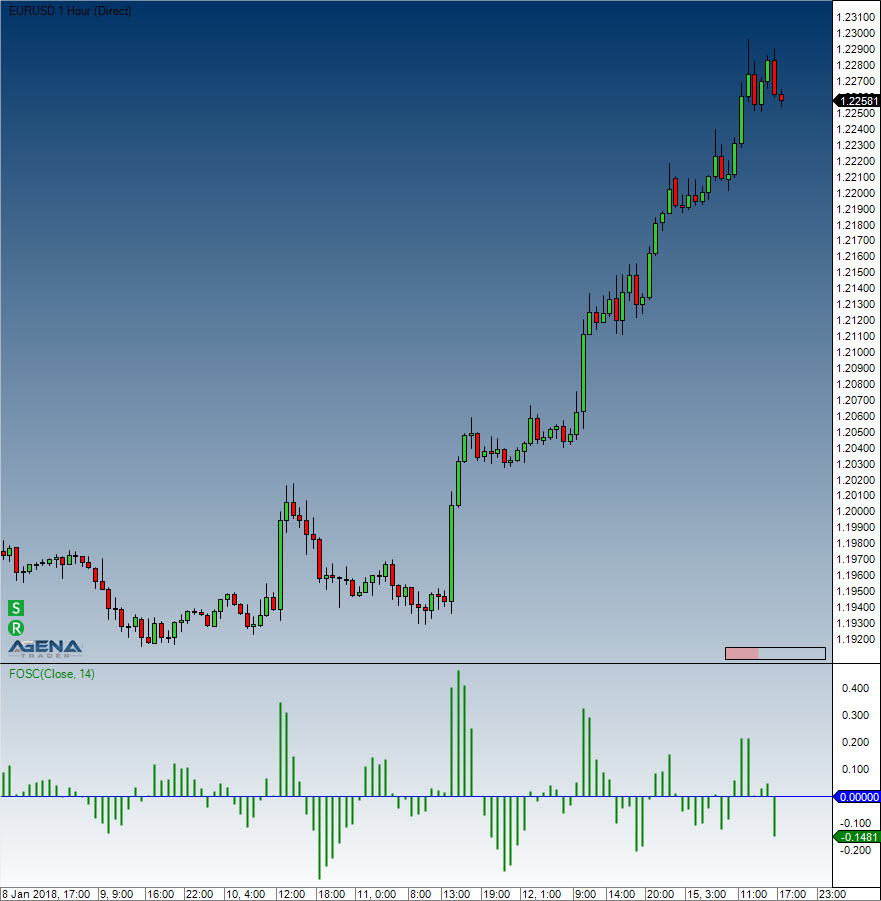
The FOSC makes a comparison of the current price against the value returned by the Time Series Forecast study. It is calculated as a percentage ratio of the difference between the close price and the Time Series Forecast value for the previous bar.
When this oscillator displays positive values, it hints that the Time Series Forecast has underestimated the price, whereas negative values suggest that the TSF has overestimated the price. Usually, an SMA also accompanies the Forecast Oscillator line in the search for oscillator reversals.
#### Further information
FMLabs:
#### Parameters
inSeries Input data series for the indicator
period Number of bars included in the calculations
#### Return value
**double**
When using this method with an index (e.g. **FOSC**(14)\[**int** barsAgo] ), the value of the indicator will be issued for the referenced bar.
#### Usage
```csharp
FOSC(int period)
FOSC(IDataSeries inSeries, int period)
FOSC(int period)[int barsAgo]
FOSC(IDataSeries inSeries, int period)[int barsAgo]
```
#### Visualization
#### Examples
```csharp
//Output for the Forecast Oscillator
Print("The current value for the Forecast Oscillator is: " + FOSC(14)[0]);
//Determining the future market direction
if (FOSC(14)[0] > 0)
Print("The FOSC is bigger than zero, which indicates rising price movements.");
```
# HighestHighIndex()
#### Description
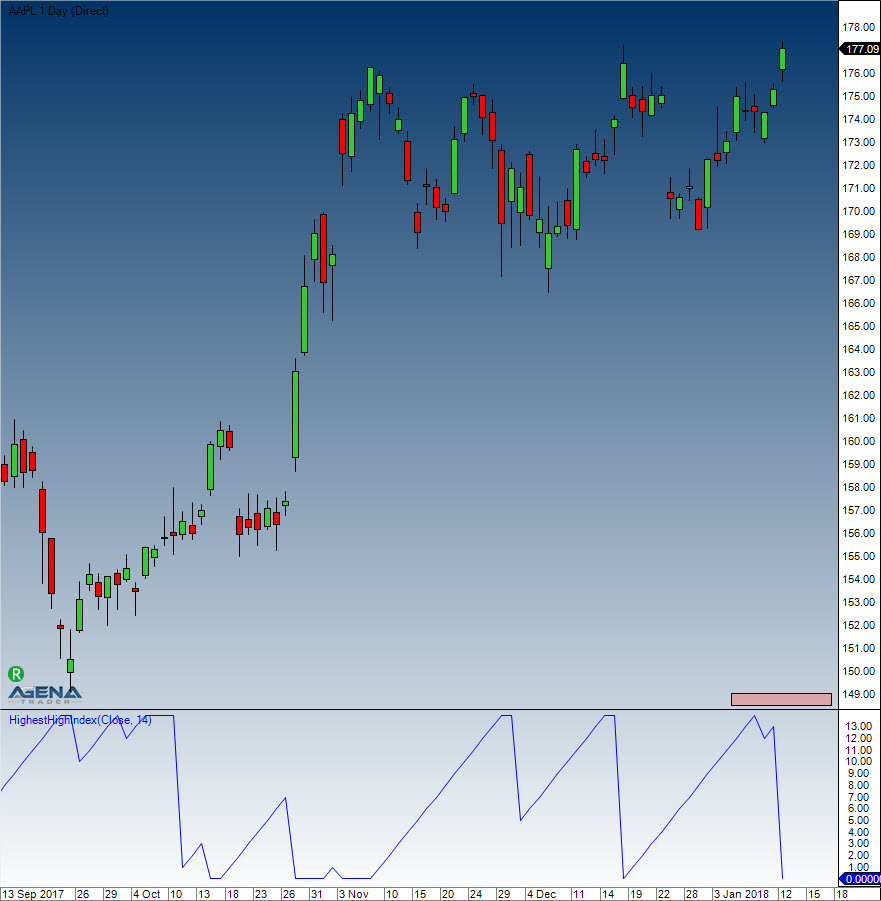
The Highest High Index prints the index for the bars with the highest high within a specified number of periods. It is slightly different from the GetSerieHighestValue() function in that it can be visualized within the chart.
See [*HighestHighPrice()*](/standard-indicators/highesthighprice), [*LowestLowPrice()*](/standard-indicators/lowestlowprice), [*LowestLowIndex*](/standard-indicators/lowestlowindex), *GetSerieHighestValue()*, *GetSerieLowestValue()*.
#### Usage
```csharp
HighestHighIndex(int BarsBack)
HighestHighIndex(int BarsBack)[int barsAgo]
```
#### Return value
**double**
When using this method with an index (e.g. **HighestHighIndex**(14)\[**int** barsAgo] ), the value of the indicator will be issued for the referenced bar.
#### **Parameter**
BarsBack Number of periods in which the highest high will be searched for
#### Visualization
#### Example
```csharp
// How many bars back is the bar with the highest high of the last 14 bars located?
Print("The highest high in the last 14 bars was " + HighestHighIndex(14)[0] + " bars ago.");
```
# HighestHighPrice()
#### Description
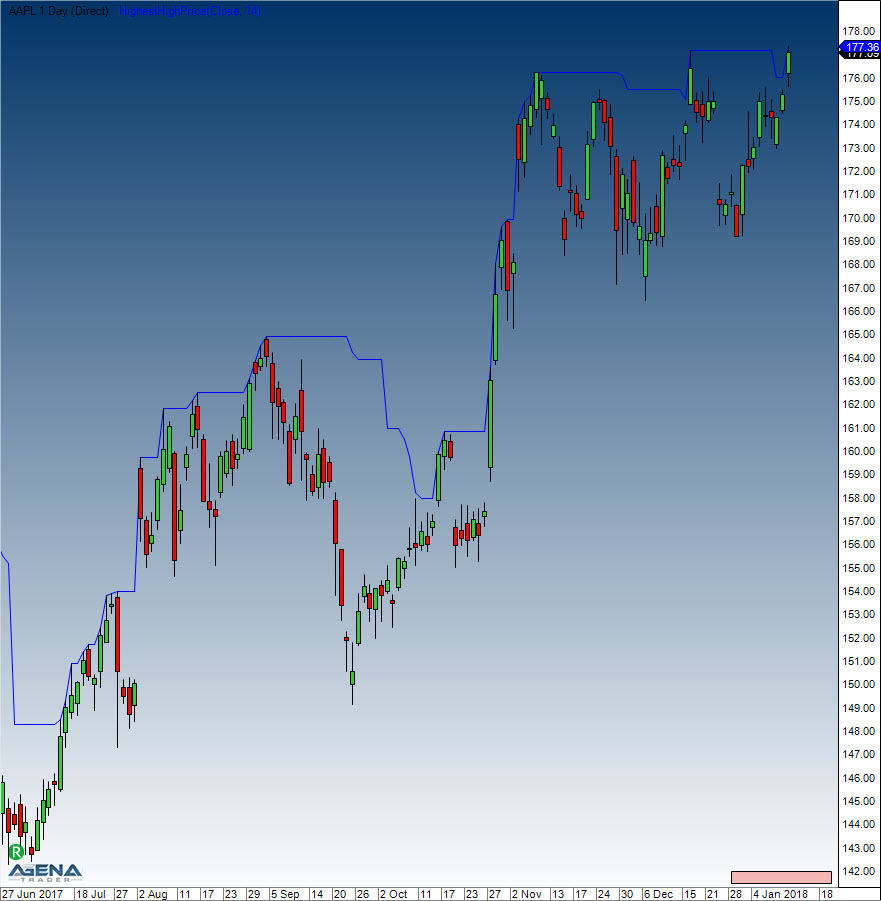
Highest High Price shows the highest high achieved within a predefined number of periods.
Unlike the GetSerieHighestValue(), this indicator can be displayed within the chart.
See [*HighestHighIndex()*,](/standard-indicators/highesthighindex) [*LowestLowPrice()*](https://agenatrader.github.io/AgenaIndicator-documentation/indicators_oscillators/#lowestlowprice), [*LowestLowIndex*](https://agenatrader.github.io/AgenaIndicator-documentation/indicators_oscillators/#lowestlowindex), *GetSerieHighestValue()*, *GetSerieLowestValue()*.
#### Usage
```csharp
HighestHighPrice(int BarsBack)
HighestHighPrice(int BarsBack)[int barsAgo]
```
#### Return value
**double**
When using this method with an index (e.g. **HighestHighPrice**(14)\[**int** barsAgo] ), the value of the indicator will be outputted for the referenced bar.
#### Parameter
BarsBack Number of periods in which the highest high will be searched for
#### Visualization
#### Example
```csharp
// What was the value of the highest high in the last 14 periods?
Print("The highest high for the last 14 bars is " + HighestHighPrice(14)[0]);
```
# IchimokuCloud
#### Description
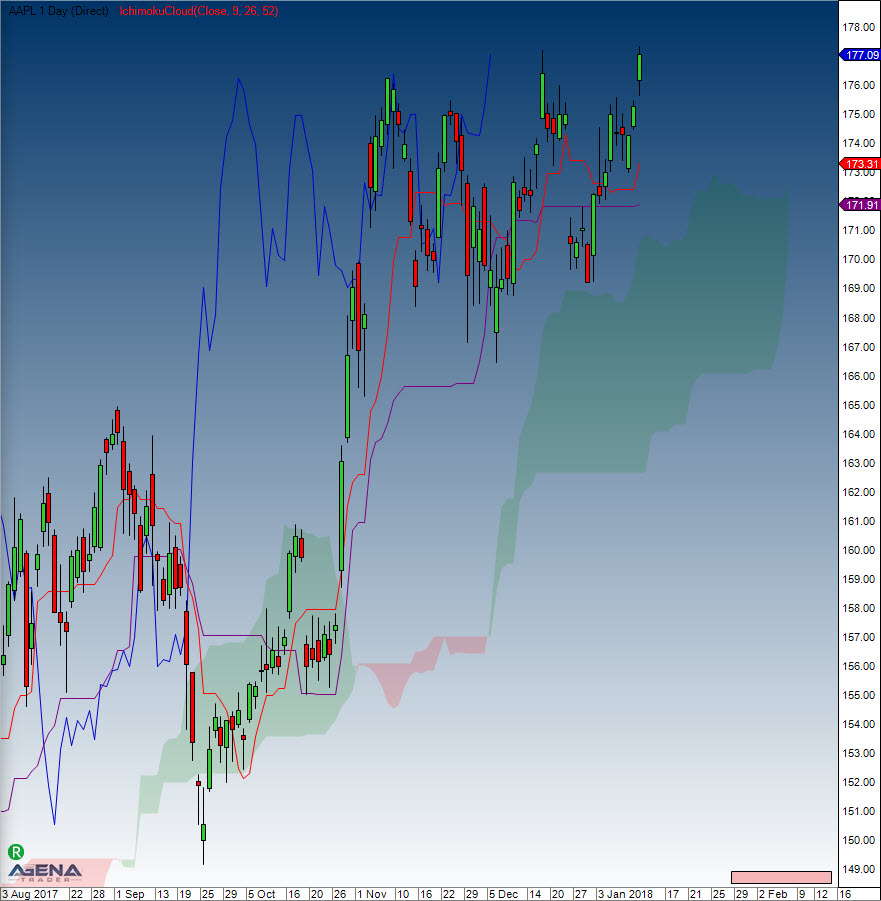
The Ichimoku Cloud, also called Ichimoku Kinko Hyo, is a very adaptable indicator that defines support and resistance, gauges momentum, identifies trend direction and provides trading signals. Ichimoku Kinko Hyo literally means "one look equilibrium chart". With just one look, traders can identify the trend and search for possible signals in that trend. The indicator was developed by the journalist Goichi Hosoda, and published in his 1969 book. Although the Ichimoku Cloud may appear complicated when looked at on the price chart, it is in fact a simple indicator that can be implemented very well – a tribute to the fact that its inventor was a journalist! What is more, the concepts are easily understandable and the signals well-defined.
**1. Tenkan Sen** – conversion line This is the median value of the 9-period high and the 9-period low. **2. Kinjun Sen** – the baseline This is the midpoint of the 26-period high and low. **3. Chikou Span** – lagging span This is the closing price plotted 26 days in the past. **4. Senkou Span A** – the first leading line This is the midpoint between the conversion line and the baseline. The leading Span A forms one of the two cloud boundaries. It is referred to as leading because it is plotted 26 periods in the future and thus builds the faster cloud boundary. **5. Senkou Span B** – the second leading line This is the midpoint of the 52-day high-low range projected 26 periods into the future, forming the slower cloud boundary. Kumo – cloud The cloud (Kumo) is the area between Senkou Span A and Senkou Span B. This area is highlighted in color, forming a cloud shape.
**Caution:** Because the cloud is drawn “into the future”, it is necessary to shift the time axis to the left in order to view it.
#### Interpretation
Similarly to the smoothing averages, the Ichimoku indicator will create a bullish signal when the Tenkan Sen crosses over the Kinjun Sen from below.
#### Further information
(Part 1, German)
(Part 2, German)
#### Usage
```csharp
IchimokuCloud(int periodFast, int periodMedium, int periodSlow)
IchimokuCloud(IDataSeries inSeries, int periodFast, int periodMedium, int periodSlow)
//TenkanSen
IchimokuCloud(int periodFast, int periodMedium, int periodSlow).TenkanSen[int barsAgo]
IchimokuCloud(IDataSeries inSeries, int periodFast, int periodMedium, int periodSlow).TenkanSen[int barsAgo]
//KijunSen
IchimokuCloud(int periodFast, int periodMedium, int periodSlow).KijunSen[int barsAgo]
IchimokuCloud(IDataSeries inSeries, int periodFast, int periodMedium, int periodSlow).KijunSen[int barsAgo]
//ChikouSpan
IchimokuCloud(int periodFast, int periodMedium, int periodSlow).ChikouSpan[int barsAgo]
IchimokuCloud(IDataSeries inSeries, int periodFast, int periodMedium, int periodSlow).ChikouSpan[int barsAgo]
//SenkouSpanA
IchimokuCloud(int periodFast, int periodMedium, int periodSlow).SenkouSpanA[int barsAgo]
IchimokuCloud(IDataSeries inSeries, int periodFast, int periodMedium, int periodSlow).SenkouSpanA[int barsAgo]
//SenkouSpanB
IchimokuCloud(int periodFast, int periodMedium, int periodSlow).SenkouSpanB[int barsAgo]
IchimokuCloud(IDataSeries inSeries, int periodFast, int periodMedium, int periodSlow).SenkouSpanB[int barsAgo]
```
#### Return value
**double**
When using this method with an index (e.g. **IchimokuCloud**(9,26,52)\[**int** barsAgo] ), the value of the indicator will be issued for the referenced bar.
#### Parameters
inSeries Input data series for the indicator
periodFast Period setting for the Tenkan line. Default: 9
periodMedium Period setting for the Kijun line. Default: 29
periodSlow Number of periods used for the calculation of the Chikou line. Default: 52
#### Visualization
# Keltner Channel
#### Description
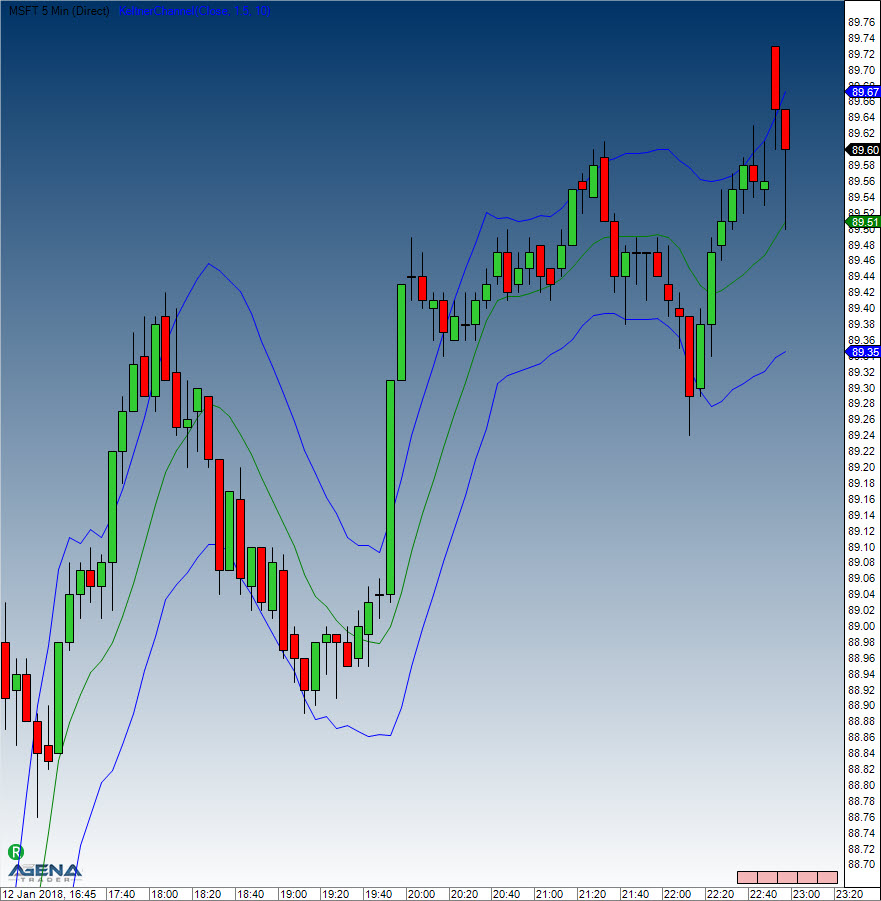
Keltner Channels are volatility-based envelopes placed above and below an EMA. This indicator shares similarities with Bollinger Bands, where the bands are set using the standard deviation. Here, instead of using the standard deviation, Keltner Channels use the Average True Range (ATR) to set the channel distance. Typically, the channels are set two Average True Range values above and two ATRs below the 20-day EMA. The EMA determines the direction and the Average True Range dictates the channel width. Keltner Channels form a trend-following indicator that is applied with the aim of identifying reversals with channel breakouts and channel direction. The channels can also be used to spot overbought and oversold levels when the trend is flat. In his 1960 book, *How to Make Money in Commodities,* Chester Keltner featured the "Ten-Day Moving Average Trading Rule," credited as the original version of Keltner Channels. This version started off with a 10-day SMA of the typical price {(H+L+C)/3)} as the center line. The 10-day SMA of the high-low range was added and subtracted to set the upper and lower channel lines respectively. Linda Bradford Raschke then brought in the more recent version of Keltner Channels in the 1980s. Similarly to Bollinger Bands, this new version made use of a volatility-based indicator, Average True Range (ATR), to set channel width. Middle line = 20-day exponential moving average Upper channel line: 20-day EMA + (2x ATR(10)) Lower channel line: 20-day EMA – (2xATR(10))
#### Interpretation
Indicators based on channels, bands and envelopes are designed to encompass most price action. Therefore, moves above or below the channel lines warrant attention because they are relatively rare. Trends often start with strong moves in one direction or another. A surge above the upper channel line shows extraordinary strength, while a plunge below the lower channel line shows extraordinary weakness. Such strong moves can signal the end of one trend and the beginning of another.
With an exponential *moving average*, *average* as their foundation, the Keltner Channels are a trend-following indicator. As with moving averages and trend-following indicators, Keltner Channels lag price action. The direction of the moving average dictates the direction of the channel. In general, a downtrend is present when the channel moves lower, while an uptrend exists when the channel moves higher. The trend is flat when the channel moves sideways.
A channel upturn and break above the upper trend line can signal the start of an uptrend. A channel downturn and break below the lower trend line can signal the start a downtrend. Sometimes a strong trend does not take hold after a channel breakout and prices oscillate between the channel lines. Such trading ranges are marked by a relatively flat moving average. The channel boundaries can then be used to identify overbought and oversold levels for trading purposes.
#### Further information
VTAD:
#### Usage
```csharp
KeltnerChannel(double offsetMutiplier, int period)
KeltnerChannel(IDataSeries inSeries, double offsetMutiplier, int period)
//Returns midline value
KeltnerChannel(double offsetMutiplier, int period)[int barsAgo]
KeltnerChannel(IDataSeries inSeries, double offsetMutiplier, int period)[int barsAgo]
//Returns upper band value
KeltnerChannel(double offsetMutiplier, int period).Upper[int barsAgo]
KeltnerChannel(IDataSeries inSeries, double offsetMutiplier, int period).Upper[int barsAgo]
//Returns lower band value
KeltnerChannel(double offsetMutiplier, int period).Lower[int barsAgo]
KeltnerChannel(IDataSeries inSeries, double offsetMutiplier, int period).Lower[int barsAgo]
```
#### Return value
**double**
When using this method with an index (e.g. **KeltnerChannel**(1.5, 15)\[**int** barsAgo] ), the value of the indicator will be issued for the referenced bar.
#### Parameters
inSeries Input data series for the indicator
offsetMultiplier Multiplier for the SMA
period Number of bars included in the calculations
#### Visualization
#### Calculation
diff.**Set**(High\[0] - Low\[0]);
**double** middle = **SMA**(Typical, Period)\[0];
**double** offset = **SMA**(diff, Period)\[0] \* offsetMultiplier;
**double** upper = middle + offset;
**double** lower = middle - offset;
#### Example
```csharp
//Current value for the Keltner Channel based on 15 periods
Print("Current value of the upper Keltner Channel band: " + KeltnerChannel(1.5, 15).Upper[0]);
Print("Current value of the middle Keltner Channel band: " + KeltnerChannel(1.5, 15)[0]);
Print("Current value of the lower Keltner Channel band: " + KeltnerChannel(1.5, 15).Lower[0]);
```
# KeyReversalUp
#### Description
The KeyReversalUp indicator searches within a predefined number of periods to find turning points with the following characteristics: 1 The current close is higher than the previous close 2 The current low is smaller than or equal to the last low of the last n bars
See [*KeyReversalDown*](https://agenatrader.github.io/AgenaIndicator-documentation/indicators_oscillators/#keyreversaldown), [*KeyReversalUpAtSMA*](https://agenatrader.github.io/AgenaIndicator-documentation/indicators_oscillators/#keyreversalupatsma), [*KeyReversalDownAtSMA*](https://agenatrader.github.io/AgenaIndicator-documentation/indicators_oscillators/#keyreversaldownatsma), [*KeyReversalUpAtEMA*](https://agenatrader.github.io/AgenaIndicator-documentation/indicators_oscillators/#keyreversalupatema), [*KeyReversalDownAtEMA*](https://agenatrader.github.io/AgenaIndicator-documentation/indicators_oscillators/#keyreversaldownatema).
#### Parameters
inSeries Input data series for the indicator period Number of bars included in the calculations
#### Return value
**double**
0 – No reversal information available 1 – Reversal information available
#### Usage
```csharp
KeyReversalUp(int period)
KeyReversalUp(IDataSeries inSeries, int period)
KeyReversalUp(int period)[int barsAgo]
KeyReversalUp(IDataSeries inSeries, int period)[int barsAgo]
```
#### Example
```csharp
// Search for an entry opportunity (longs)
if (KeyReversalUp(10)[0] == 1)
Print("A long reversal formation has occurred.");
```
# KeyReversalDown
#### Description
KeyReversalDown searches within a predefined number of periods to find turning points with the following characteristics:
1 The current close is lower than the previous close 2 The current high is higher than or equal to the highest high of the last n bars
See [*KeyReversalUp*](https://agenatrader.github.io/AgenaIndicator-documentation/indicators_oscillators/#keyreversalup), [*KeyReversalUpAtSMA*](https://agenatrader.github.io/AgenaIndicator-documentation/indicators_oscillators/#keyreversalupatsma), [*KeyReversalDownAtSMA*](https://agenatrader.github.io/AgenaIndicator-documentation/indicators_oscillators/#keyreversaldownatsma), [*KeyReversalUpAtEMA*](https://agenatrader.github.io/AgenaIndicator-documentation/indicators_oscillators/#keyreversalupatema), [*KeyReversalDownAtEMA*](https://agenatrader.github.io/AgenaIndicator-documentation/indicators_oscillators/#keyreversaldownatema).
#### Parameters
inSeries Input data series for the indicator period Number of bars included in the calculations
#### Return value
**double**
0 – No reversal information available 1 – Reversal information available
#### Usage
```csharp
KeyReversalDown(int period)
KeyReversalDown(IDataSeries inSeries, int period)
KeyReversalDown(int period)[int barsAgo]
KeyReversalDown(IDataSeries inSeries, int period)[int barsAgo]
```
#### Example
```csharp
// Look for a short entry
if (KeyReversalDown(10)[0] == 1)
Print("A short reversal formation has occurred.");
```
# KeyReversalUpAtSMA
#### Description
KeyReversalUpAtSMA searches within a predefined number of periods to find turning points with the following characteristics:
1 The current close is higher than the previous close 2 The current low is smaller than or equal to the lowest low within n bars 3 The current low has touched or breached an SMA
See [*KeyReversalUp*](https://agenatrader.github.io/AgenaIndicator-documentation/indicators_oscillators/#keyreversalup), [*KeyReversalDown*](https://agenatrader.github.io/AgenaIndicator-documentation/indicators_oscillators/#keyreversaldown), [*KeyReversalDownAtSMA*](https://agenatrader.github.io/AgenaIndicator-documentation/indicators_oscillators/#keyreversaldownatsma), [*KeyReversalUpAtEMA*](https://agenatrader.github.io/AgenaIndicator-documentation/indicators_oscillators/#keyreversalupatema), [*KeyReversalDownAtEMA*](https://agenatrader.github.io/AgenaIndicator-documentation/indicators_oscillators/#keyreversaldownatema).
#### Parameters
inSeries Input data series for the indicator period Number of bars included in the calculations SMAperiod Number of periods included in the calculation of the SMA
#### Return value
**double**
0 – No reversal information 1 – Reversal information found
#### Usage
```csharp
KeyReversalUpAtSMA(int period, int SMAperiod)
KeyReversalUpAtSMA(IDataSeries inSeries, int period, int SMAperiod)
KeyReversalUpAtSMA(int period, int SMAperiod)[int barsAgo]
KeyReversalUpAtSMA(IDataSeries inSeries, int period, int SMAperiod)[int barsAgo]
```
#### Example
```csharp
// Look for a long entry
if (KeyReversalUpAtSMA(10)[0] == 1)
Print("A long reversal formation has occurred.");
```
# KeyReversalDownAtSMA
#### Description
KeyReversalDownAtSMA searches within a predefined number of periods to find a turning point with the following characteristics:
1 The current close is lower than the previous close 2 The current high is higher than or equal to the highest high within the last n periods 3 The current high has touched or breached an SMA
See [*KeyReversalUp*](https://agenatrader.github.io/AgenaIndicator-documentation/indicators_oscillators/#keyreversalup), [*KeyReversalDown*](https://agenatrader.github.io/AgenaIndicator-documentation/indicators_oscillators/#keyreversaldown), [*KeyReversalUpAtSMA*](https://agenatrader.github.io/AgenaIndicator-documentation/indicators_oscillators/#keyreversalupatsma), [*KeyReversalUpAtEMA*](https://agenatrader.github.io/AgenaIndicator-documentation/indicators_oscillators/#keyreversalupatema), [*KeyReversalDownAtEMA*](https://agenatrader.github.io/AgenaIndicator-documentation/indicators_oscillators/#keyreversaldownatema).
#### Parameters
inSeries Input data series for the indicator period Number of bars included in the calculations SMAperiod Number of periods included in the SMA calculation
#### Return value
**double**
0 – No reversal formation found 1 – Reversal formation present
#### Usage
```csharp
KeyReversalDownAtSMA(int period, int SMAperiod)
KeyReversalDownAtSMA(IDataSeries inSeries, int period, int SMAperiod)
KeyReversalDownAtSMA(int period, int SMAperiod)[int barsAgo]
KeyReversalDownAtSMA(IDataSeries inSeries, int period, int SMAperiod)[int barsAgo]
```
#### Example
```csharp
// Search for a short entry
if (KeyReversalDownAtSMA(10)[0] == 1)
Print("A short reversal formation has occurred.");
```
# KeyReversalUpAtEMA
#### Description
KeyReversalUpAtEMA searches within a predefined number of periods to find a reversal formation with the following characteristics:
1 The current close is higher than the previous close 2 The current low is smaller than or equal to the lowest low within the last n bars 3 The current low has touched or breached an EMA
See [*KeyReversalUp*](https://agenatrader.github.io/AgenaIndicator-documentation/indicators_oscillators/#keyreversalup), [*KeyReversalDown*](https://agenatrader.github.io/AgenaIndicator-documentation/indicators_oscillators/#keyreversaldown), [*KeyReversalUpAtSMA*](https://agenatrader.github.io/AgenaIndicator-documentation/indicators_oscillators/#keyreversalupatsma), [*KeyReversalDownAtSMA*](https://agenatrader.github.io/AgenaIndicator-documentation/indicators_oscillators/#keyreversaldownatsma), [*KeyReversalDownAtEMA*](https://agenatrader.github.io/AgenaIndicator-documentation/indicators_oscillators/#keyreversaldownatema).
#### Parameters
inSeries Input data series for the indicator period Number of bars included in the calculations EMAperiod Number of periods included in the EMA calculation
#### Return value
**double**
0 – No reversal information found 1 – Reversal information found
#### Usage
```csharp
KeyReversalUpAtEMA(int period, int EMAperiod)
KeyReversalUpAtEMA(IDataSeries inSeries, int period, int EMAperiod)
KeyReversalUpAtEMA(int period, int EMAperiod)[int barsAgo]
KeyReversalUpAtEMA(IDataSeries inSeries, int period, int EMAperiod)[int barsAgo]
```
#### Example
```csharp
// Search for a long entry
if (KeyReversalUpAtEMA(10)[0] == 1)
Print("A long reversal formation has occurred.");
```
# KeyReversalDownAtEMA
#### Description
KeyReversalDownAtEMA searches within a predefined number of periods to find a reversal formation with the following characteristics:
1 The current close is lower than the previous close 2 The current high is larger than or equal to the highest high of the last n bars 3 The current high has touched or breached an EMA
See [*KeyReversalUp*](https://agenatrader.github.io/AgenaIndicator-documentation/indicators_oscillators/#keyreversalup), [*KeyReversalDown*](https://agenatrader.github.io/AgenaIndicator-documentation/indicators_oscillators/#keyreversaldown), [*KeyReversalUpAtSMA*](https://agenatrader.github.io/AgenaIndicator-documentation/indicators_oscillators/#keyreversalupatsma), [*KeyReversalDownAtSMA*](https://agenatrader.github.io/AgenaIndicator-documentation/indicators_oscillators/#keyreversaldownatsma), [*KeyReversalUpAtEMA*](https://agenatrader.github.io/AgenaIndicator-documentation/indicators_oscillators/#keyreversalupatema).
#### Parameters
inSeries Input data series for the indicator period Number of bars included in the calculations EMAperiod Number of periods used to calculate the EMA
#### Return value
**double**
0 – No reversal formation found
1 – Reversal formation found
#### Usage
```csharp
KeyReversalDownAtEMA(int period, int EMAperiod)
KeyReversalDownAtEMA(IDataSeries inSeries, int period, int EMAperiod)
KeyReversalDownAtEMA(int period, int EMAperiod)[int barsAgo]
KeyReversalDownAtEMA(IDataSeries inSeries, int period, int EMAperiod)[int barsAgo]
```
#### Example
```csharp
// Search for a short entry
if (KeyReversalDownAtEMA(10)[0] == 1)
Print("A short reversal formation has occurred.");
```
# Linear Regression
#### Description
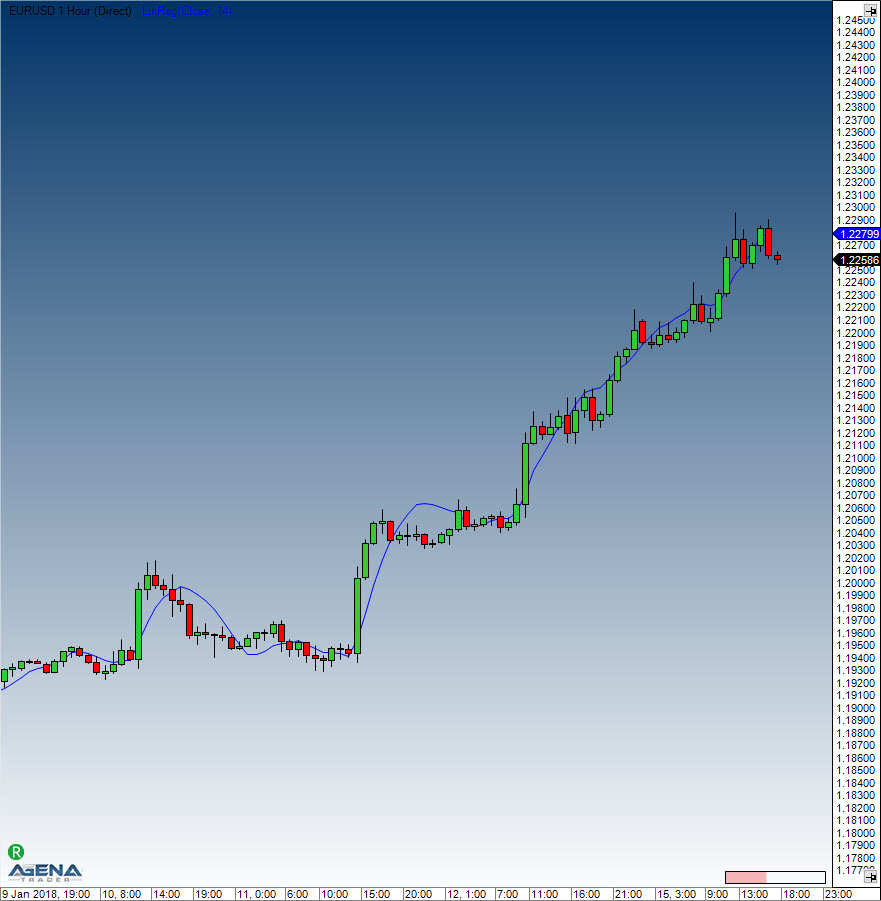
Linear Regression is used to determine trends. Here, the prices are set as dependent variables, and time is set as an independent variable. Using the method for determination of the smallest square, a straight line is placed through the price movements in such a way that the distance between the prices and the line deviates as little as possible. Using this method also establishes a trend between two points in time. The regression line can be found in the middle of the price channel, and the indicator provides the end values of multiple linear regression trend lines. Each point along this indicator is therefore an end value of a linear regression trend line. What results is quite similar to a smoothing average, with the difference that the regression line exhibits less lag.
See [*R-Squared*](https://agenatrader.github.io/AgenaIndicator-documentation/indicators_oscillators/#r-squared), [*LinRegSlope*](https://agenatrader.github.io/AgenaIndicator-documentation/indicators_oscillators/#linregslope), [*LinRegIntercept*](https://agenatrader.github.io/AgenaIndicator-documentation/indicators_oscillators/#linregintercept).
#### Further information
#### Interpretation
The linear regression indicator is used as a prognosis tool for the future developments of the instrument. If the prices are rising or falling steadily, then it can be expected that they will return to a more realistic/reasonable level. In other words: the indicator shows where the price should be, a deviation from the regression is assumed to be short-lived and to be corrected soon.
#### Usage
```csharp
LinReg(int period)
LinReg(IDataSeries inSeries, int period)
LinReg(int period)[int barsAgo]
LinReg(IDataSeries inSeries, int period)[int barsAgo]
```
#### Return value
**double**
When using this method with an index (e.g. **LinReg**(14)\[**int** barsAgo] ), the value of the indicator will be issued for the referenced bar.
#### Parameters
inSeries Input data series for the indicator
period Number of bars included in the calculations
#### Visualization
#### Example
```csharp
//Show the current values of the regression line
Print("The current value for the linear regression is: " + LinReg(14)[0]);
```
# LinRegIntercept
#### Description
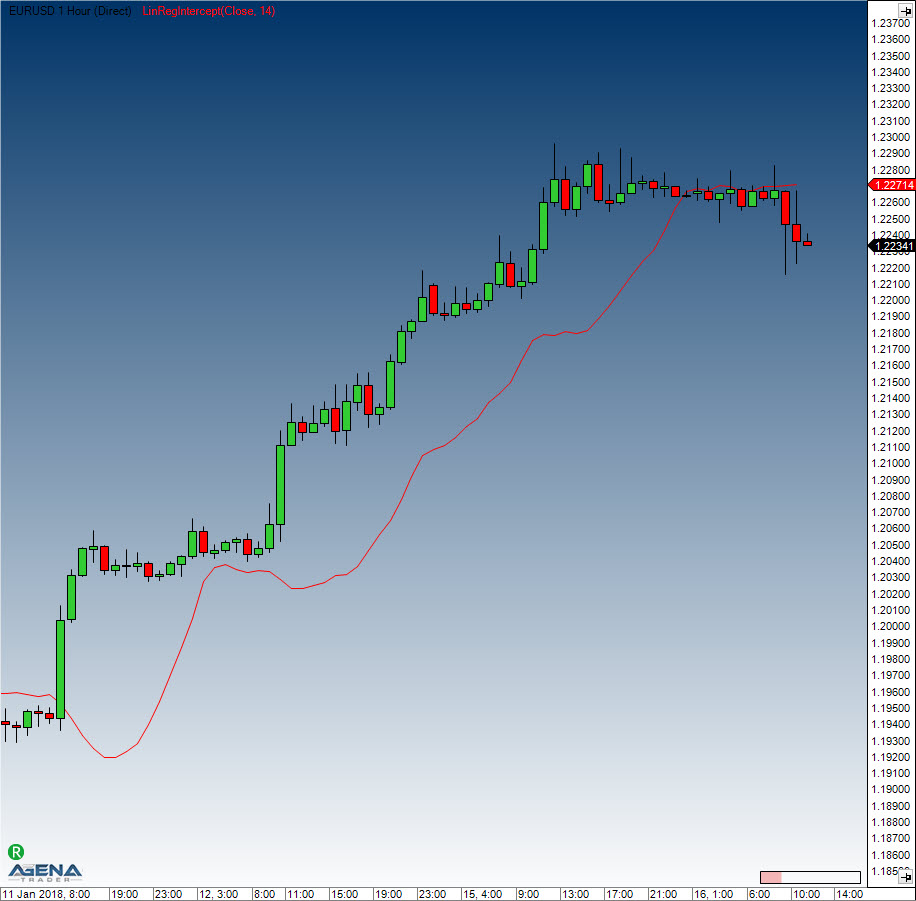
The Linear Regression Intercept outputs the value of the regression constant, i.e. the mathematical intersection of where the regression line meets the price axis.
A straight line can be accurately determined with the help of the slope and intercept values.
See [*Linear Regression*](https://agenatrader.github.io/AgenaIndicator-documentation/indicators_oscillators/#linearregression), [*R-Squared*](https://agenatrader.github.io/AgenaIndicator-documentation/indicators_oscillators/#r-squared) [*LinRegSlope*](https://agenatrader.github.io/AgenaIndicator-documentation/indicators_oscillators/#linregslope).
#### Interpretation
The indicator is not used by itself, but is simply a component of trading systems that analyze trade trends with the help of the linear regression.
#### Usage
```csharp
LinRegIntercept(int period)
LinRegIntercept(IDataSeries inSeries, int period)
LinRegIntercept(int period)[int barsAgo]
LinRegIntercept(IDataSeries inSeries, int period)[int barsAgo]
```
#### Return value
**double**
When using this method with an index (e.g. **LinRegIntercept**(14)\[**int** barsAgo] ), the value of the indicator will be issued for the referenced bar.
#### Parameters
inSeries Input data series for the indicator
period Number of bars included in the calculations
#### Visualization
#### Example
```csharp
//Show current value
Print("The current value of the regression constant is: " + LinRegIntercept(14)[0]);
```
# LinRegSlope
#### Description
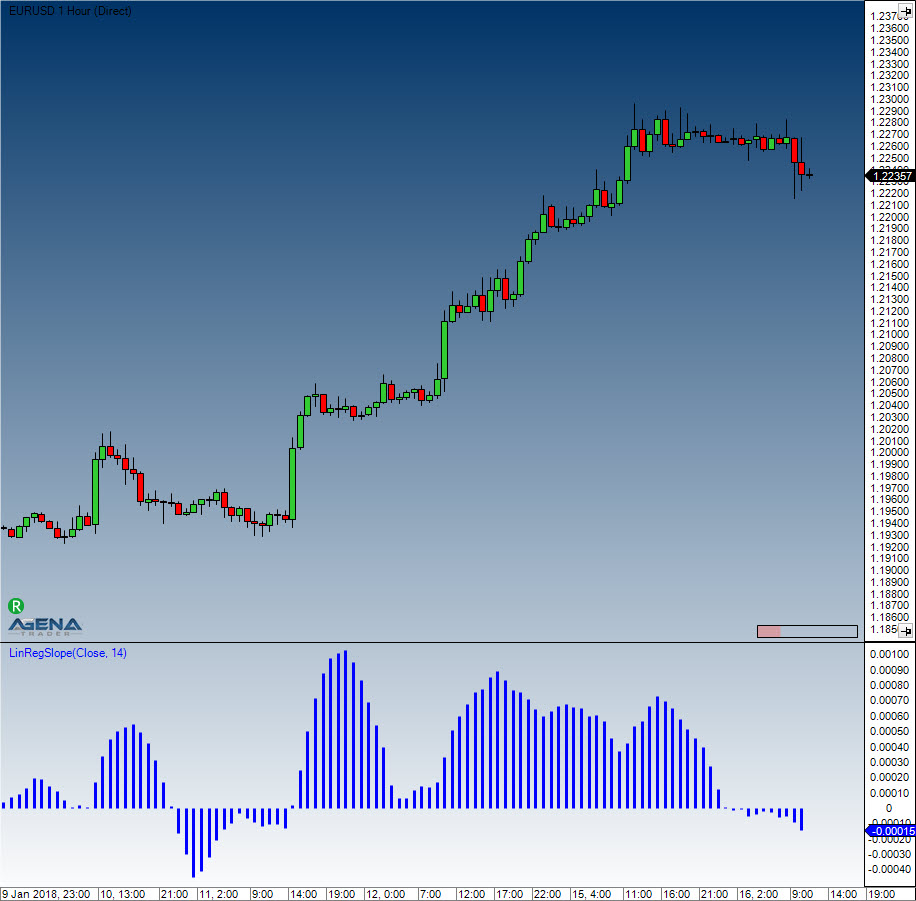
The Linear Regression Slope outputs the slope of the linear regression line, and is a measurement of the regression line’s “elevation”.
See [*Linear Regression*](https://agenatrader.github.io/AgenaIndicator-documentation/indicators_oscillators/#linearregression), [*R-Squared*](https://agenatrader.github.io/AgenaIndicator-documentation/indicators_oscillators/#r-squared), [*LinRegIntercept*](https://agenatrader.github.io/AgenaIndicator-documentation/indicators_oscillators/#linregintercept).
#### Interpretation
Simply put: in an uptrend, the elevation is positive and facing upwards. The opposite applies to downtrends. This indicator is not very useful for determining overbought or oversold areas, but can be used to measure the strength of a trend. It should be used in combination with other indicators to identify potential entries.
#### Usage
```csharp
LinRegSlope(int period)
LinRegSlope(IDataSeries inSeries, int period)
LinRegSlope(int period)[int barsAgo]
LinRegSlope(IDataSeries inSeries, int period)[int barsAgo]
```
#### Return value
**double**
When using this method with an index (e.g. **LinRegSlope**(14)\[**int** barsAgo] ), the value of the indicator will be issued for the referenced bar.
#### Parameters
inSeries Input data series for the indicator
period Number of bars included in the calculations
#### Visualization
#### Example
```csharp
//Current value for the slope:
Print("The current value for the inclination of the linear regression line is: " + LinRegSlope(14)[0]);
```
# LowestLowIndex()
#### Description
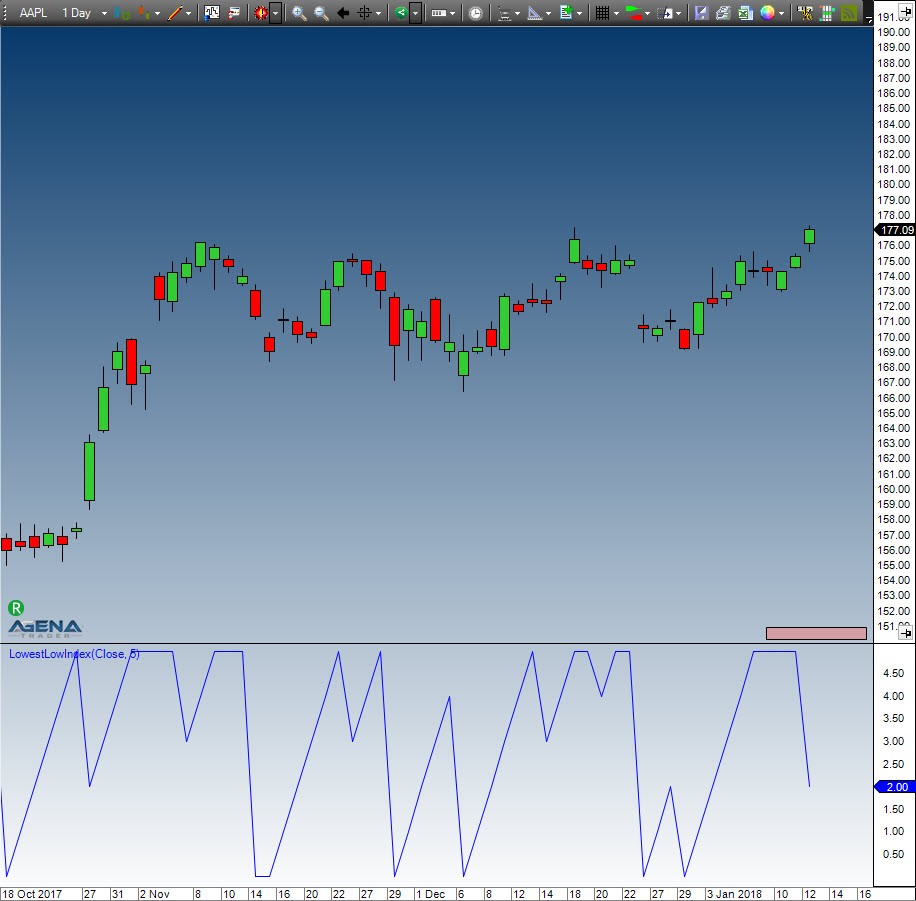
LowestLowIndex delivers the index of the bar with the lowest low within a predefined number of periods.
Differently to GetSerieLowestValue(), one can display this indicator within a chart.
See [*HighestHighPrice()*](https://agenatrader.github.io/AgenaIndicator-documentation/indicators_oscillators/#highesthighprice), [*HighestHighIndex()*](https://agenatrader.github.io/AgenaIndicator-documentation/indicators_oscillators/#highesthighindex), [*LowestLowPrice()*](https://agenatrader.github.io/AgenaIndicator-documentation/indicators_oscillators/#lowestlowprice), *GetSerieHighestValue()*, *GetSerieLowestValue()*.
#### Usage
```csharp
LowestLowIndex(int BarsBack)
LowestLowIndex(int BarsBack)[int barsAgo]
```
#### Return value
**double**
When using this method with an index (e.g. **LowestLowIndex**(14)\[**int** barsAgo] ), the value of the indicator will be issued for the referenced bar.
**Parameter**
BarsBack Number of periods within which the highest high shall be searched for
#### Visualization
#### Example
```csharp
// How many bars back is the lowest low of the last 14 bars located?
Print("The lowest low of the last 14 bars was " + LowestLowIndex(14)[0] + " bars ago.");
```
# LowestLowPrice()
#### Description
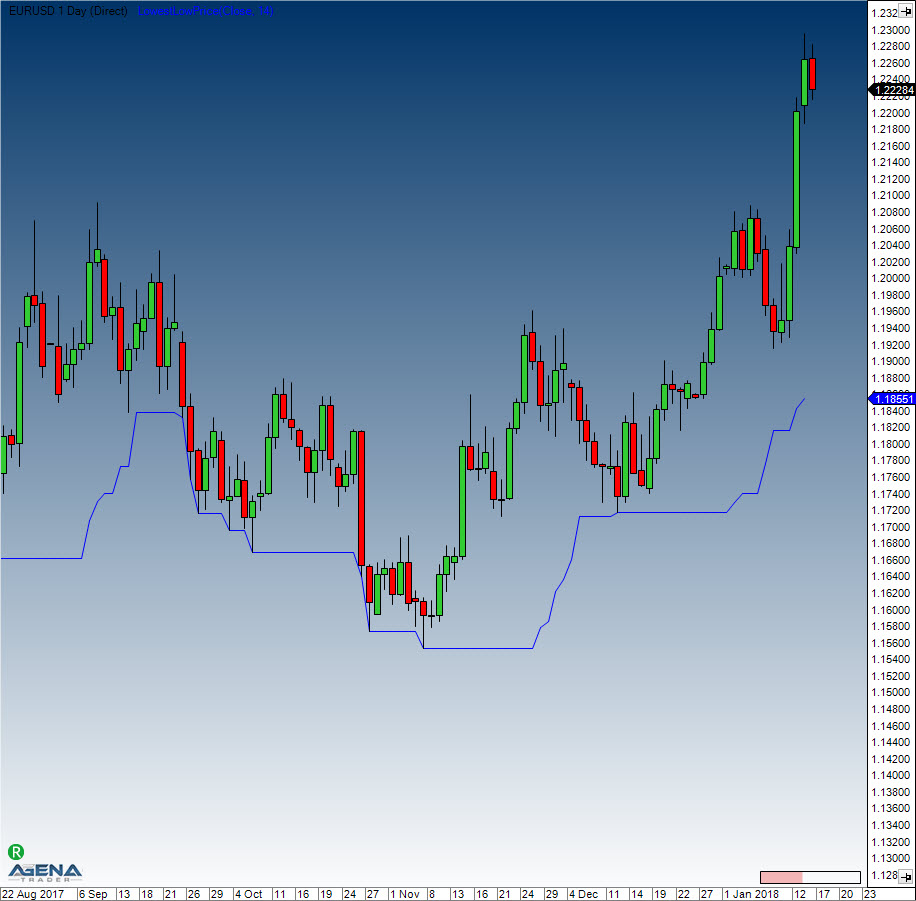
LowestLowPrice delivers the value of the lowest low within a predefined number of periods.
Unlike the GetSerieLowestValue(), this indicator can be viewed within the chart.
See [*HighestHighPrice()*](https://agenatrader.github.io/AgenaIndicator-documentation/indicators_oscillators/#highesthighprice), [*HighestHighIndex()*](https://agenatrader.github.io/AgenaIndicator-documentation/indicators_oscillators/#highesthighindex), [*LowestLowIndex*](https://agenatrader.github.io/AgenaIndicator-documentation/indicators_oscillators/), *GetSerieHighestValue()*, *GetSerieLowestValue()*.
#### Usage
```csharp
LowestLowPrice(int BarsBack)
LowestLowPrice(int BarsBack)[int barsAgo]
```
#### Return value
**double**
When using this method with an index (e.g. **LowestLowPrice**(14)\[**int** barsAgo] ), the value of the indicator will be issued for the referenced bar.
#### Parameter
BarsBack Number of periods within which the low will be searched for
#### Visualization
#### Example
```csharp
// What value did the lowest low of the last 14 periods have?
Print("The lowest low of the last 14 bars is " + LowestLowPrice(14)[0]);
```
# MACD
#### Description
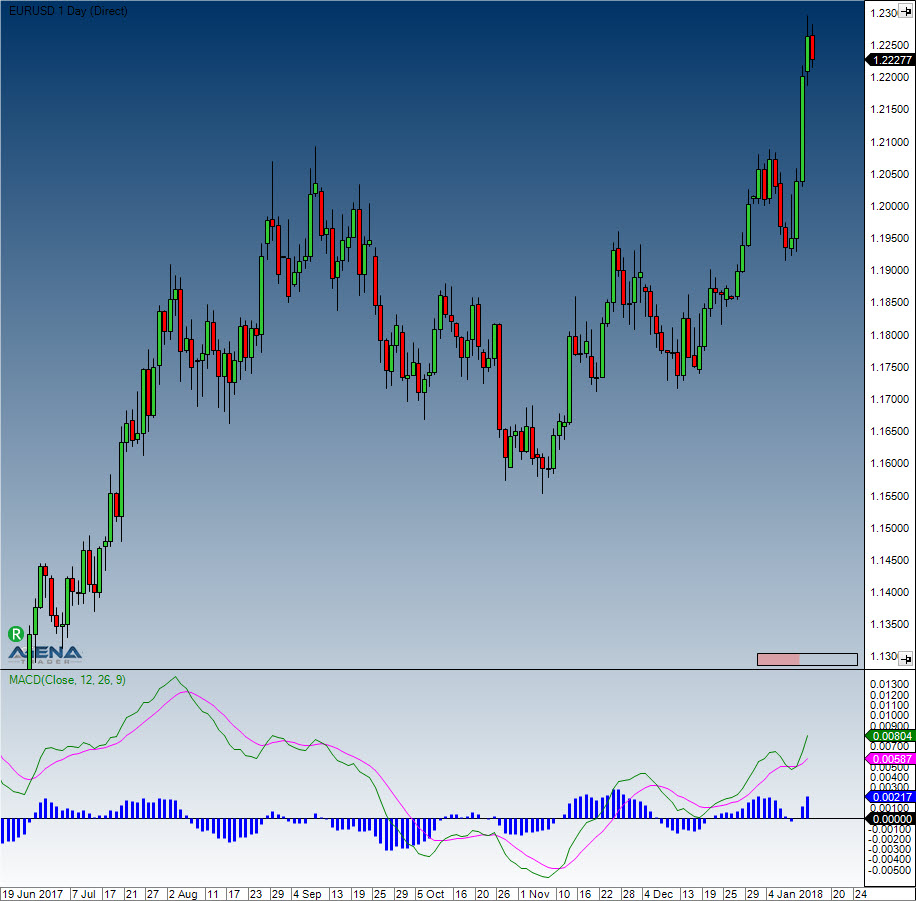
The Moving Average Convergence-Divergence (MACD) indicator, developed by Gerald Appel in the late 70s, is one of the simplest, most effective momentum indicators out there. The MACD makes two trend-following indicators, moving averages, average, become a momentum oscillator by subtracting the longer moving average from the shorter moving average. As a result of this, the MACD offers great advantages: trend following and momentum. The MACD moves above and below the zero line as the moving averages converge, cross and diverge again. Signal line crossovers, centerline crossovers and divergences are things that traders can keep an eye out for to generate signals. Since the MACD is unbounded, it is not especially useful for identifying overbought or oversold levels. The MACD line is the 12-day Exponential Moving Average (EMA) minus the 26-day EMA, and closing prices are used for these moving averages. A 9-day EMA of the MACD line is plotted with the indicator acting as a signal line and identifying turns. The MACD histogram shows the difference between the MACD and its 9-day EMA, i.e. the signal line. When the MACD line is above its signal line, the histogram is positive, and vice versa when the MACD line is below its signal line.
The typical settings used with the MACD are the values 12, 26 and 9. However, other values can also be used depending on the trading style and goals in mind.
#### Interpretation
As its name implies, the MACD is all about the convergence and divergence of the two moving averages. Convergence occurs when the moving averages move towards each other. Divergence occurs when the moving averages move away from each other. The shorter moving average (12-day) is faster and responsible for most MACD movements. The longer moving average (26-day) is slower and less reactive to price changes in the underlying security.
The MACD line oscillates above and below the zero line, which is also known as the centerline. These crossovers signal that the 12-day EMA has crossed the 26-day EMA. The direction, of course, depends on the direction of the moving average cross. Positive MACD indicates that the 12-day EMA is above the 26-day EMA. Positive values increase as the shorter EMA diverges further from the longer EMA. This means upside momentum is increasing. Negative MACD values indicate that the 12-day EMA is below the 26-day EMA. Negative values increase as the shorter EMA diverges further below the longer EMA. This means downside [momentum](https://agenatrader.github.io/AgenaIndicator-documentation/indicators_oscillators/#momentum) is increasing. Signal line crossovers are the most common MACD signals. The signal line is a 9-day EMA of the MACD line. As a moving average of the indicator, it trails the MACD and makes it easier to spot MACD turns. A bullish crossover occurs when the MACD turns up and crosses above the signal line. A bearish crossover occurs when the MACD turns down and crosses below the signal line. Crossovers can last a few days or a few weeks, it all depends on the strength of the move.
Due diligence is required before relying on these common signals. Signal line crossovers at positive or negative extremes should be viewed with caution. Even though the MACD does not have upper and lower limits, chartists can estimate historical extremes with a simple visual assessment. It takes a strong move in the underlying security to push momentum to an extreme. Even though the move may continue, momentum is likely to slow and this will usually produce a signal line crossover at the extremities. Volatility in the underlying security can also increase the number of crossovers.
#### Further information
VTAD:
#### Usage
```csharp
MACD(int fast, int slow, int smooth)
MACD(IDataSeries inSeries, int fast, int slow, int smooth)
//For the value of the MACD line
MACD(int fast, int slow, int smooth)[int barsAgo]
MACD(IDataSeries inSeries, int fast, int slow, int smooth)[int barsAgo]
//For the value of the signal line
MACD(int fast, int slow, int smooth).Avg[int barsAgo]
MACD(IDataSeries inSeries, int fast, int slow, int smooth).Avg[int barsAgo]
//For the difference between the MACD and the signal line
MACD(int fast, int slow, int smooth).Diff[int barsAgo]
MACD(IDataSeries inSeries, int fast, int slow, int smooth).Diff[int barsAgo]
```
#### Return value
**double**
When using this method with an index (e.g. **MACD**(12,26,9)\[**int** barsAgo] ), the value of the indicator will be issued for the referenced bar.
#### Parameters
inSeries Input data series for the indicator
fast Number of periods for the fast EMA calculation
slow Number of periods for the slow EMA calculation
smooth Number of periods for the EMA calculation of the signal line
#### Visualization
#### Example
```csharp
//Show the current values for the MACD
Print("The current value for the MACD line is: " + MACD(12,26,9)[0]);
Print("The current value for the signal line is: " + MACD(12,26,9).Avg[0]);
Print("The difference between the MACD and the signal line is: " + MACD(12,26,9).Diff[0]);
```
# MAEnvelopes
#### Description
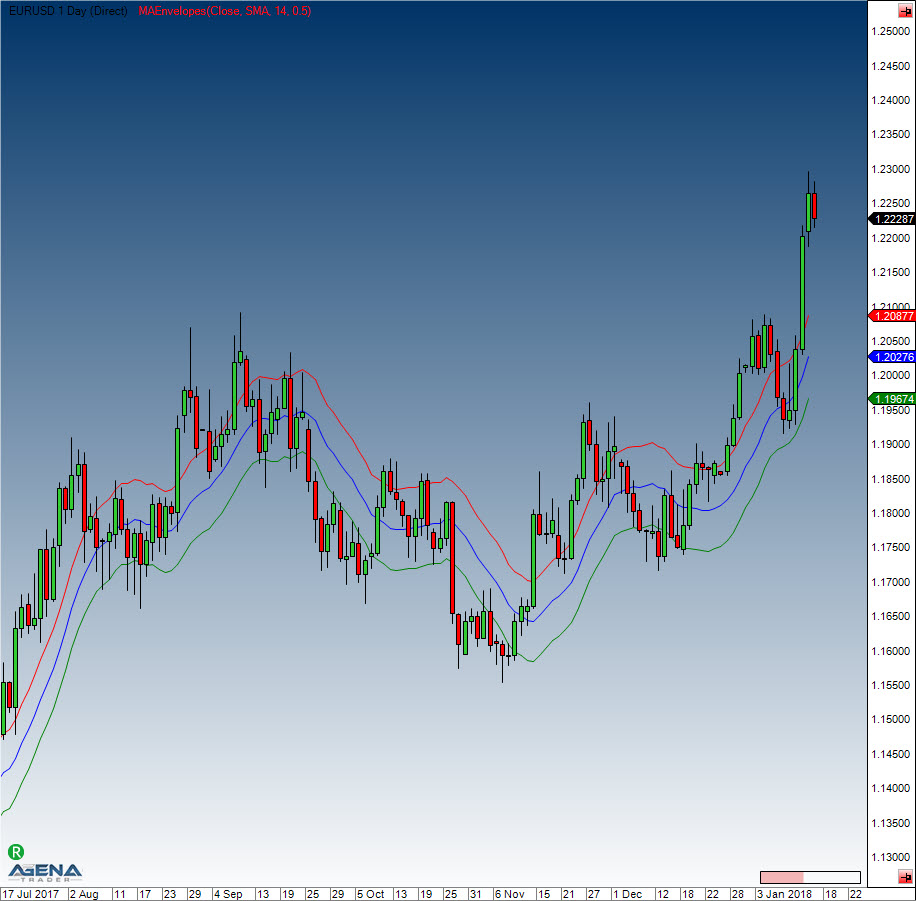
These Moving Average Envelopes are percentage-based envelopes placed above and below a moving average. The moving average forms the base for this indicator, and can be a either simple or exponential moving average. Each MA envelope is set the same percentage above or below the moving average, thereby creating parallel bands that follow price action. Moving Average Envelopes can be used as a trend-following indicator with a moving average as the base. But this indicator is not limited to just trend following: the envelopes can also be used for spotting overbought and oversold levels when the trend is relatively flat.
Indicators based on channels, bands and envelopes are intended to encompass most price action, which is why moves above or below the envelopes deserve attention. Trends often start with sharp moves in one direction – a surge above the upper envelope shows extraordinary strength, while a dive below the lower envelope exhibits extraordinary weakness. Strong moves such as these can signal the end of one trend and the start of another.
With a *moving average* as the foundation, Moving Average Envelopes are a trend-following indicator. As with moving averages, the envelopes lag price action. The direction of the moving average dictates the direction of the channel, so generally, when the channel moves lower, a downtrend exists, and when the channel goes higher, an uptrend is present. When the channel moves sideways, this signifies that the trend is flat.
Occasionally, it happens that a strong trend does not establish itself after an envelope break, and prices move into a trading range. Trading ranges such as these are characterized by a relatively flat moving average. These envelopes can then be used to spot overbought and oversold levels. A move above the upper envelope shows an overbought situation; a move below the lower envelope signals an oversold situation.
#### Usage
```csharp
MAEnvelopes(double envelopePercentage, MAEnvelopesMAType maType, int period)
MAEnvelopes(IDataSeries inSeries, double envelopePercentage, MAEnvelopesMAType maType, int period)
//For the upper band
MAEnvelopes(double envelopePercentage, MAEnvelopesMAType maType, int period).Upper[int barsAgo]
MAEnvelopes(IDataSeries inSeries, double envelopePercentage, MAEnvelopesMAType maType, int period).Upper[int barsAgo]
//For the middle band
MAEnvelopes(double envelopePercentage, MAEnvelopesMAType maType, int period).Middle[int barsAgo]
MAEnvelopes(IDataSeries inSeries, double envelopePercentage, MAEnvelopesMAType maType, int period).Middle[int barsAgo]
//For the lower band
MAEnvelopes(double envelopePercentage, MAEnvelopesMAType maType, int period).Lower[int barsAgo]
MAEnvelopes(IDataSeries inSeries, double envelopePercentage, MAEnvelopesMAType maType, int period).Lower[int barsAgo]
```
#### Return value
**double**
When using this method with an index (e.g. **MAEnvelopes**(14,SMA,1.5)\[**int** barsAgo] ), the value of the indicator will be issued for the referenced bar.
#### Parameters
v Input data series for the indicator
period Number of bars included in the calculations
envelopePercentage Distance of the upper and lower bands from the middle line in percent
maType Type of moving average used, possible choices are: - EMA - HMA - SMA (default) - TMA - TEMA - WMA
#### Visualization
#### Usage
```csharp
//Value output for the upper band
Print("Upper band of the MA Envelope: " + MAEnvelopes(1.5, MAEnvelopesMAType.SMA, 14).Upper[0]);
//Value output for the middle band
Print("Middle band of the MA Envelope: " + MAEnvelopes(1.5, MAEnvelopesMAType.SMA, 14).Middle[0]);
//Value output for the lower band
Print("Lower band of the MA Envelope: " + MAEnvelopes(1.5, MAEnvelopesMAType.SMA, 14).Lower[0]);
```
# Momentum (MOM)
#### Description
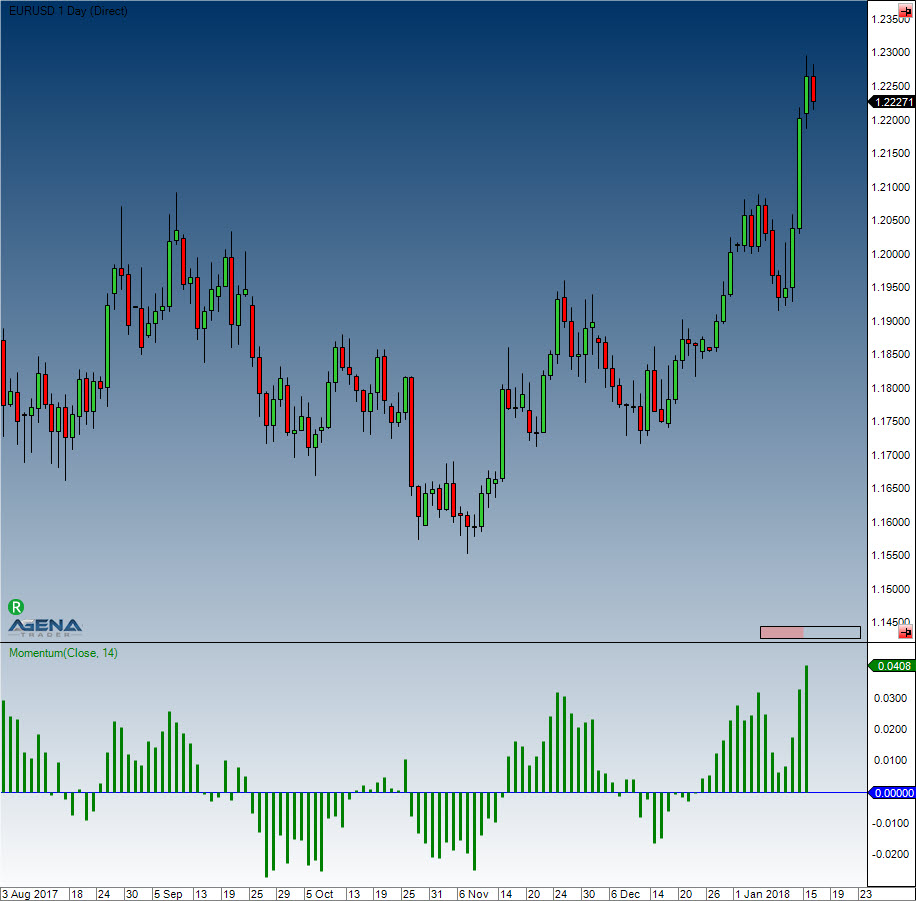
Momentum is one of the most popular indicators available, the first choice of many traders. This relatively simple indicator is so popular because it measures the attenuation of the motion without the need for complex formulas. The momentum indicator represents a whole family of indicators that measure a movement’s strength. Other representatives in this case are the RSI or CCI, and so on. In the illustration below, the indicator is a graph that oscillates around a zero point. There is no fixed scale in percentage terms, and the value can be quite far removed from the zero point; this usually happens when the price makes an exceptionally strong leap, which is why the indicator predominantly shows the direction in which the current prices are moving towards.
#### Interpretation
Entry signals are generated when the indicator crosses the zero line.
See [*ROC*](https://agenatrader.github.io/AgenaIndicator-documentation/indicators_oscillators/#rate-of-change-roc).
#### Further information
#### Usage
```csharp
Momentum(int period)
Momentum (IDataSeries inSeries, int period)
Momentum (int period)[int barsAgo]
Momentum (IDataSeries inSeries, int period)[int barsAgo]
```
#### Return value
**double**
When using this method with an index (e.g. **Momentum**(14)\[**int** barsAgo] ), the value of the indicator will be issued for the referenced bar.
#### Parameters
inSeries Input data series for the indicator
period Number of bars included in the calculations
#### Visualization
#### Example
```csharp
//Output of the values for the momentum indicator.
Print("The current value for the momentum is " + Momentum(14)[0]);
```
# Money Flow Index (MFI)
#### Description
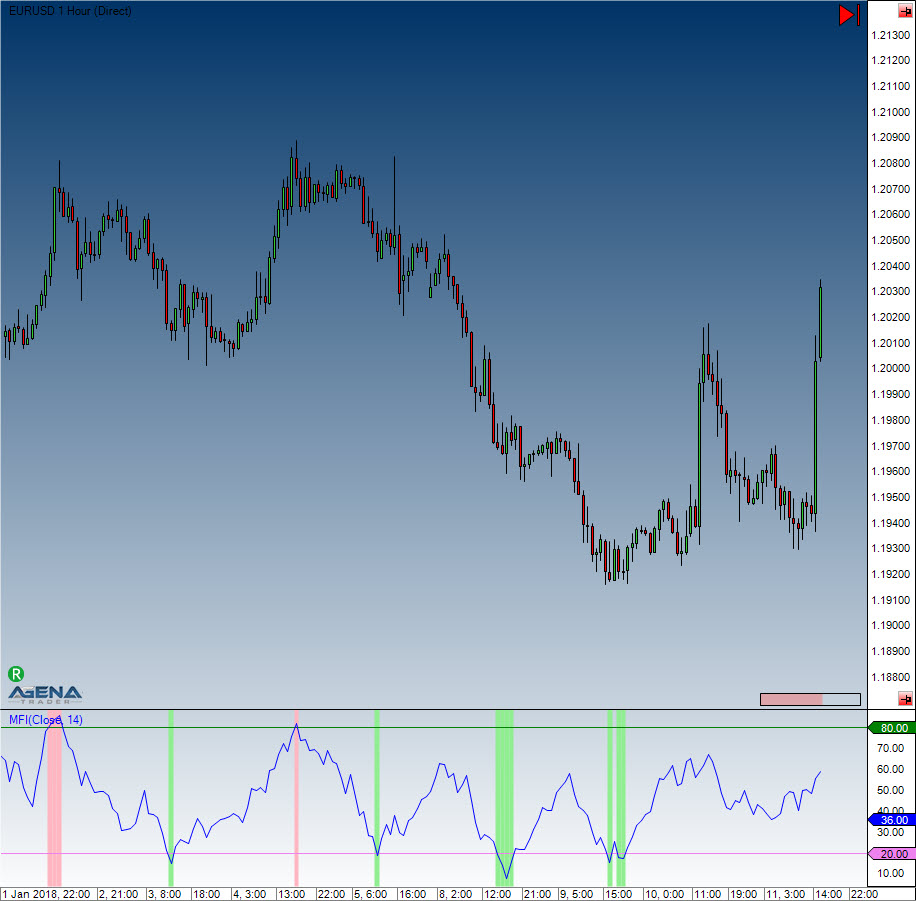
The MFI is an oscillator that makes use of both volume and price to measure buying and selling pressure. MFI, which was developed by Gene Quong and Avrum Soudack, is also known as volume-weighted [*RSI*](https://agenatrader.github.io/AgenaIndicator-documentation/indicators_oscillators/#relative-strength-index-rsi). MFI starts with the typical price for each period. Money flow is then positive when this aforementioned typical price increases (buying pressure) and negative when it decreases (selling pressure). A ratio of positive-negative money flow is then inserted into an RSI formula to come up with an oscillator that fluctuates between 0 and 100. The MFI, which is a momentum oscillator linked to volume, is best used for identifying reversals and price extremes with a variety of different signals.
#### Interpretation
The MFI is interpreted similarly to the RSI indicator. The MFI’s decisive factor is much stronger than the RSI’s when it comes to trend direction, due to the fact that volume is included in the calculation.
#### Further information
VTAD:
#### Usage
```csharp
MFI(int period)
MFI(IDataSeries inSeries, int period)
MFI(int period)[int barsAgo]
MFI(IDataSeries inSeries, int period)[int barsAgo]
```
#### Return value
**double**
When using this method with an index (e.g. **MFI**(14)\[**int** barsAgo] ), the value of the indicator will be issued for the referenced bar.
#### Parameters
inSeries Input data series for the indicator
period Number of bars included in the calculations
#### Visualization
#### Example
```csharp
//Current MFI value
Print("The current value for the MFI is: " + MFI(14)[0]);
```
# Moving Averages
#### Variants
[*DEMA*](https://agenatrader.github.io/AgenaIndicator-documentation/indicators_oscillators/#dema-double-exponential-moving-average) - Double Exponential Moving Average
[*EMA*](https://agenatrader.github.io/AgenaIndicator-documentation/indicators_oscillators/#ema-exponential-moving-average) - Exponential Moving Average
[*HMA*](https://agenatrader.github.io/AgenaIndicator-documentation/indicators_oscillators/#hma-hull-moving-average) - Hull Moving Average
[*KAMA*](https://agenatrader.github.io/AgenaIndicator-documentation/indicators_oscillators/#kama-kaufmans-adaptive-moving-average) - Kaufman's Adaptive Moving Average
[*MAMA*](https://agenatrader.github.io/AgenaIndicator-documentation/indicators_oscillators/#mama-mesa-adaptive-moving-average) - Mesa Adaptive Moving Average
[*SMA*](https://agenatrader.github.io/AgenaIndicator-documentation/indicators_oscillators/#sma-simple-moving-average) - Simple Moving Average
[*TEMA*](https://agenatrader.github.io/AgenaIndicator-documentation/indicators_oscillators/#tema-triple-exponential-moving-average) - Triple Exponential Moving Average
[*TMA*](https://agenatrader.github.io/AgenaIndicator-documentation/indicators_oscillators/#tma-triangular-moving-average) - Triangular Moving Average
[*TRIX*](https://agenatrader.github.io/AgenaIndicator-documentation/indicators_oscillators/#trix-triple-exponential-moving-average) - Triple Exponential Moving Average
[*T3*](https://agenatrader.github.io/AgenaIndicator-documentation/indicators_oscillators/#t3-triple-exponential-moving-average) - Triple Exponential Moving Average
[*VMA*](https://agenatrader.github.io/AgenaIndicator-documentation/indicators_oscillators/#vma-variable-moving-average) - Variable Moving Average
[*VWMA*](https://agenatrader.github.io/AgenaIndicator-documentation/indicators_oscillators/#vwma-volume-weighted-moving-average) - Volume Weighted Moving Average
[*WMA*](https://agenatrader.github.io/AgenaIndicator-documentation/indicators_oscillators/#wma-weighted-moving-average), [*VMA*](https://agenatrader.github.io/AgenaIndicator-documentation/indicators_oscillators/#vma-variable-moving-average) - Weighted Moving Average
[*ZLEMA*](https://agenatrader.github.io/AgenaIndicator-documentation/indicators_oscillators/#zlema-zero-lag-exponential-moving-average) - Zero Lag Exponential Moving Average
#### Interpretation
The arithmetic average, also known as the moving average or simple moving average, smoothes the progression of the price for better trend detection. Moving averages are trend-following indicators; they follow the course and do not lead. IsSerieRising averages show uptrends, whereas falling averages display downtrends. By varying the period input, the time delay of the average can be changed. The smaller the period interval, the quicker the reaction time will be, but as a consequence, the smoothing effect will also be diminished. The opposite is true when increasing the period selection. The most popular choices are: 38, 50, 100 and 200 days. The 200-day moving average in particular has a significant importance for institutional traders, since it displays the long-term trend. 200 trading days are equal to a trading year. When the 200 MA is broken, then buy/sell signals are generated.
#### Applications
**Crossing of two averages**
The integration of multiple moving averages is used to identify trend sequences and minimize the number of false signals. When two arithmetic averages are used, whereby one is a short-term and the other a long-term, more interesting signals can be generated. One such application can be seen with Richard Donchian’s methodologies, such as using the 5 and 20-day averages. The Double Crossover Method generates signals in the following way:
If the short-term average crosses the long-term average from below, this is called a Golden Cross, and a buy signal is generated. Higher trading volume reinforces the quality of the signal. The long-term average works as a support line in an uptrend.
If the short-term average crosses the long-term average from above, this is called a Death Cross. It generates a sell signal. Higher trading volume reinforces the signal quality. In a downtrend, the long-term average functions as a resistance line.
**Crossing of three moving averages**
Another method is to use three moving averages (Triple Crossover Method). This method was presented by R.C Allen, who used the 4, 9, and 18-day averages and suggested that a trend change is hinted at when the 4MA crosses the 9MA from bottom to top. An entry is only recommended when all lines are above the 18-day period. An exit is initiated when the 4-day MA moves below the 9-day MA. (Source: VTAD)
# DEMA - Double Exponential Moving Average
#### Description
The Double Exponential Moving Average is a technical indicator created by Patrick Mulloy. The calculation hereof is done using a simple as well as a double exponential moving average.
#### Interpretation
The DEMA is a fast-working moving average that reacts quicker to market changes. The DEMA may be used as a stand-alone indicator or in tandem with other indicators. The general interpretations are the same as for regular moving averages.
#### Usage
```csharp
DEMA(int period)
DEMA(IDataSeries inSeries, int period)
DEMA(int period)[int barsAgo]
DEMA(IDataSeries inSeries, int period)[int barsAgo]
```
#### Return value
**double**
When using this method with an index (e.g. **DEMA**(20)\[**int** barsAgo] ), the value of the indicator will be issued for the referenced bar.
#### Parameters
inSeries Input data series for the indicator
period Number of bars included in the calculations
#### Visualization
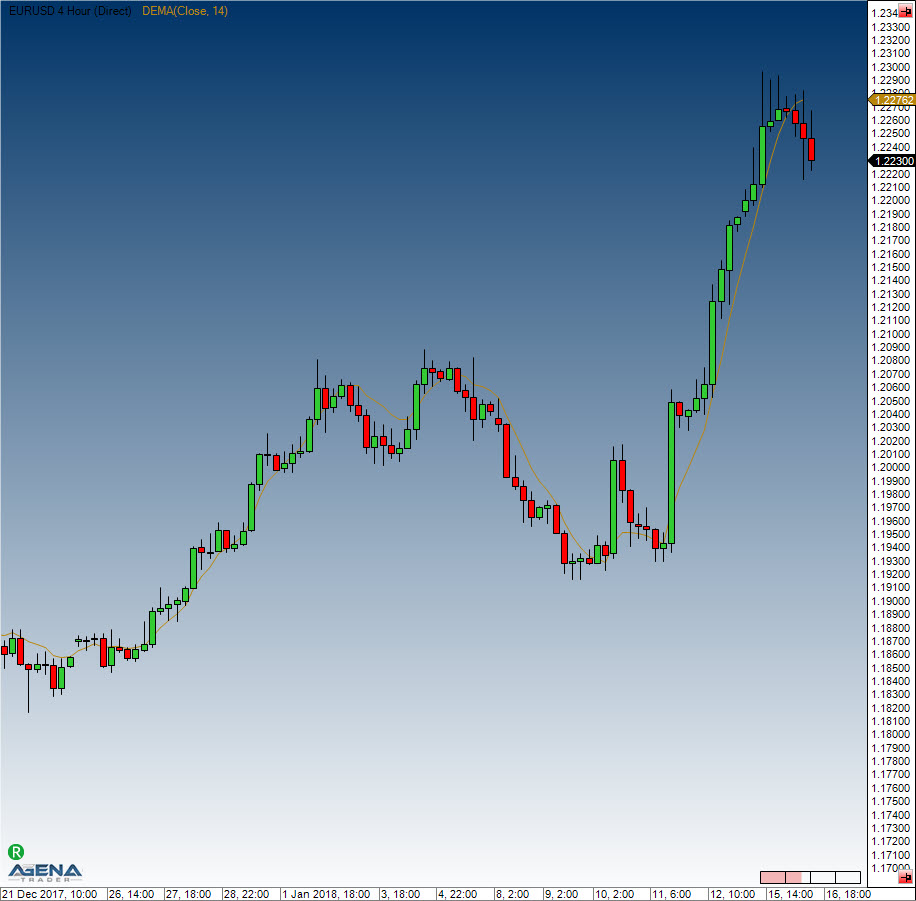
#### Calculation
```csharp
Value.Set(2 * EMA(InSeries[0], Period)[0] - EMA(EMA(InSeries[0], Period), Period)[0]);
```
#### Example
```csharp
//Output the values for the DEMA
Print("The current DEMA value is " + DEMA(20)[0]);
```
# EMA - Exponential Moving Average
#### Description
Exponential moving averages work to reduce lag by weighting recent prices more heavily. The weighting given to the most recent price depends on the number of periods in the moving average. Calculating an exponential moving average involves three steps. 1. Calculate the simple moving average. An exponential moving average (EMA) must start somewhere, therefore a simple moving average is used as the previous period's EMA in the beginning calculation. 2. Calculate the weighting multiplier. 3. Calculate the EMA.
#### Interpretation
The EMA is used by many traders in the most varying of timeframes. It is especially meaningful within the 15, 60 and 240-minute charts. The EMA 200 line is also especially popular with traders.
If the price rises sharply and moves away quickly from the respective EMA line, it is possible to enter countertrend positions in order to profit from the potential return to the moving average. General interpretations of the moving averages also apply to the EMA.
#### Usage
```csharp
EMA(int period)
EMA(IDataSeries inSeries, int period)
EMA(int period)[int barsAgo]
EMA(IDataSeries inSeries, int period)[int barsAgo]
```
#### Return value
**double**
When using this method with an index (e.g. **EMA**(20)\[**int** barsAgo] ), the value of the indicator will be issued for the referenced bar.
#### Parameters
inSeries Input data series for the indicator
period Number of bars included in the calculations
#### Visualization
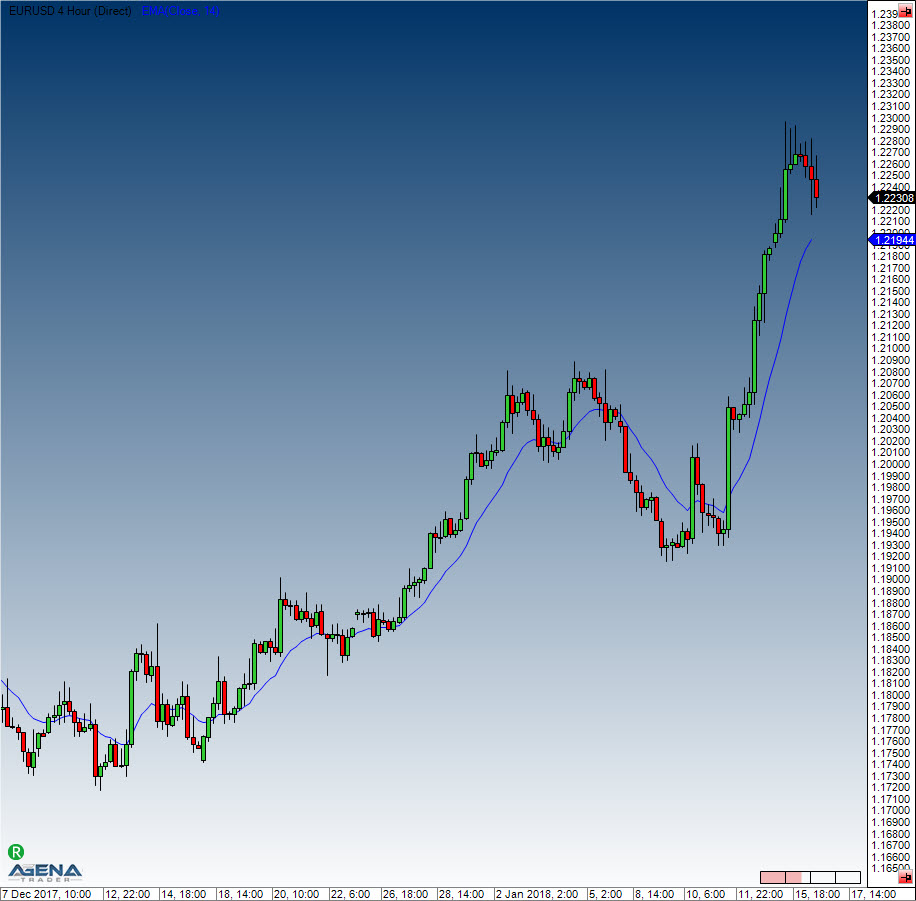
#### Calculation
```csharp
Value.Set(ProcessingBarIndex == 0 ? InSeries[0] : InSeries[0] * (2.0 / (1 + Period)) + (1 - (2.0 / (1 + Period))) * Value[1]);
```
#### Example
```csharp
//Output the value for the EMA
Print("The current EMA value is " + EMA(20)[0]);
```
# EMA MTF (MultiTimeFrame)
#### Description
The EMA MTF indicator is a multi-timeframe version of the standard EMA indicator. This indicator basically allows you to make calculationgs in a different timeframe than that of the current chart.
For more information, see [*EMA*](https://agenatrader.github.io/AgenaIndicator-documentation/indicators_oscillators/#ema-exponential-moving-average).
Also see [*BollingerMTF*](https://agenatrader.github.io/AgenaIndicator-documentation/indicators_oscillators/#bollingermtf), [*SmaMTF*](https://agenatrader.github.io/AgenaIndicator-documentation/indicators_oscillators/#smamtf).
#### Visualization
A 5-minute chart with an EMA(20) calculated with hourly bars as the underlying input:
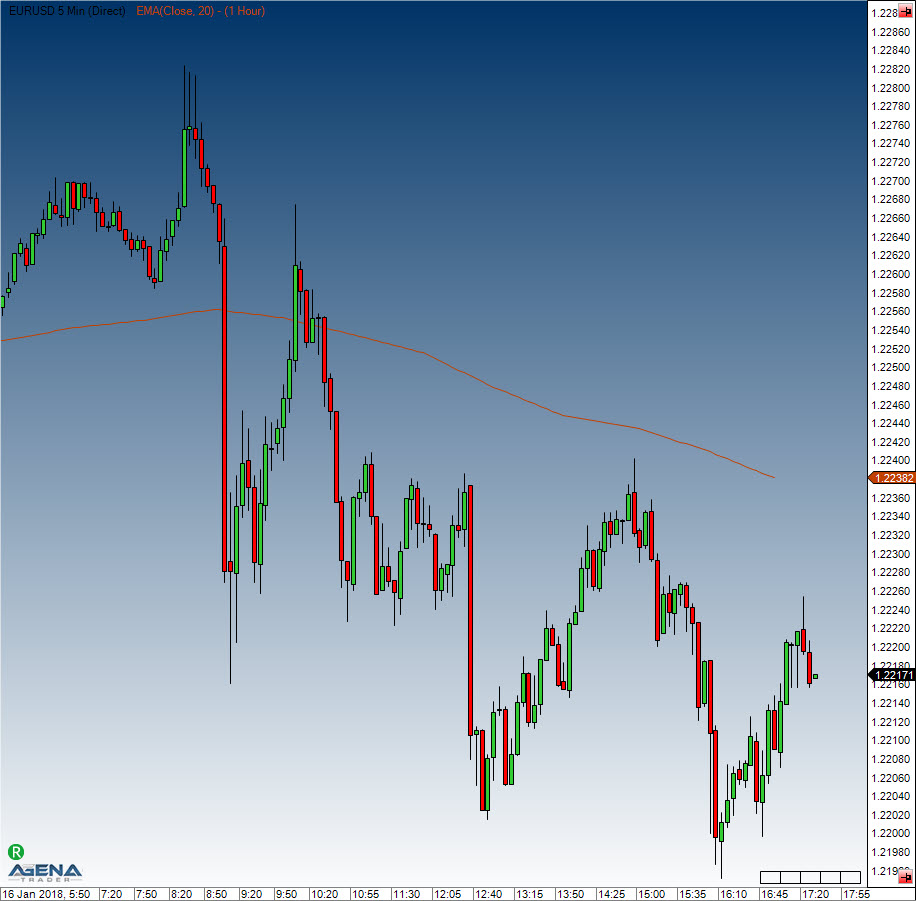
# HMA - Hull Moving Average
#### Description
The Hull Moving Average, invented by Alan Hull, is a fast-working moving average that gets rid of almost all delays/lags (zero lag). The calculation is carried out using several weighted moving averages, thereby partially reducing the smoothing effect. Hull’s methodology uses square roots of the period instead of the actual period itself.
#### Interpretation
The same interpretations as for the moving averages apply to the HMA, the only major distinction being the reduced lag. See [*Moving Averages*](https://agenatrader.github.io/AgenaIndicator-documentation/indicators_oscillators/#moving-averages).
#### Usage
```csharp
HMA(int period)
HMA(IDataSeries InSeries, int period)
HMA(int period)[int barsAgo]
HMA(IDataSeries InSeries, int period)[int barsAgo]
```
#### Return value
**double**
When using this method with an index (e.g. **HMA**(21)\[**int** barsAgo] ), the value of the indicator will be issued for the referenced bar.
#### Parameters
inSeries Input data series for the indicator
period Number of bars included in the calculations
#### Visualization
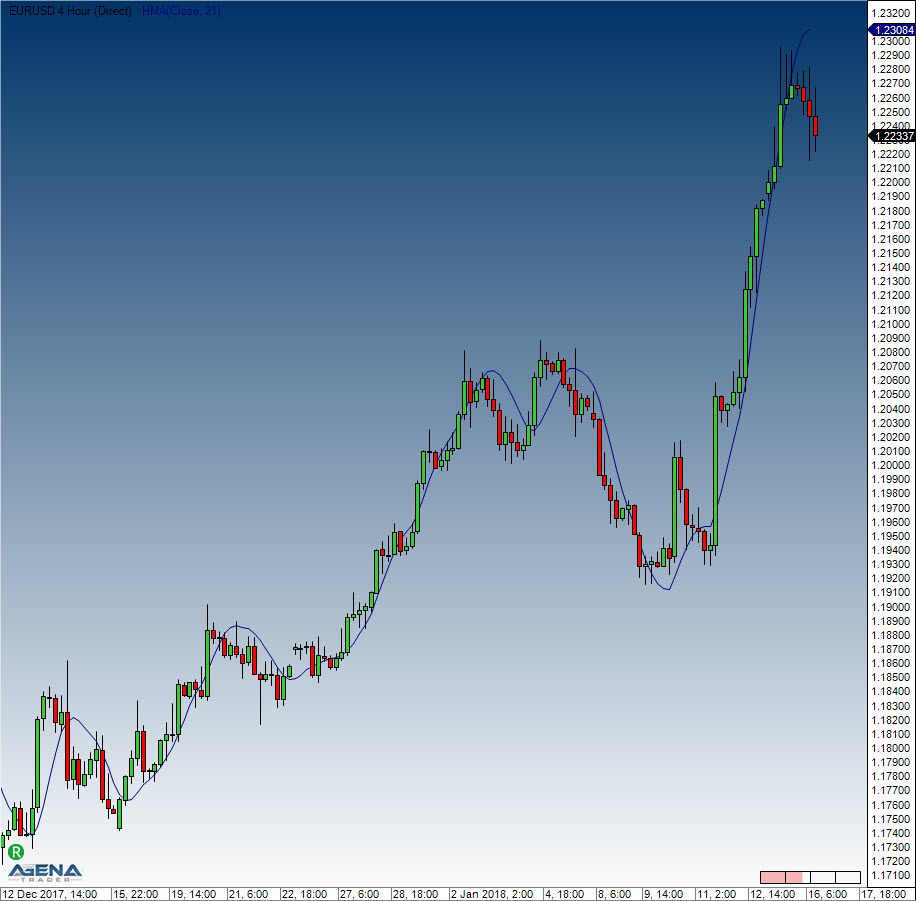
#### Calculation
```csharp
double value1 = 2 * WMA(InSeries, (int)(Period / 2))[0];
double value2 = WMA(InSeries, Period)[0];
diffSeries.Set(value1 - value2);
Value.Set(WMA(diffSeries, (int) Math.Sqrt(Period))[0]);
```
#### Example
```csharp
//Output the value for the HMA
Print("The current HMA value is " + HMA(21)[0]);
```
# KAMA - Kaufman's Adaptive Moving Average
#### Description
The KAMA is based on an EMA in which a trend efficiency ratio controls the weight of future price changes. This efficiency ratio (the squared efficiency factor) is a measure that can also be used by itself. The trend efficiency is the ratio of the absolute price change from the start to the end of the period, and the total of the absolute daily price changes. At higher trending efficiencies (i.e. straight price movements) without too much variation, the extra price carries a higher weighting, according to a shorter day period setting. Lower trending frequencies carry a smaller weighting.
#### Interpretation
Kaufman mentions that a rising KAMA value can be interpreted as a buying signal, whilst falling KAMA values assume the prices to be falling. Kaufman also defines a maximum and minimum value for the calculation of the smoothing components. The efficiency ratio is converted using specified maximum and minimum values, which are applied to newly incoming price changes. Kaufman uses 2 (short period) as a minimum value and 30 (long period) as a maximum value. The number of days for the determination of the efficiency ratio is one of the more important parameters for the KAMA.
For a more general interpretation of moving averages, please see the following chapter: [*Moving Averages*](https://agenatrader.github.io/AgenaIndicator-documentation/indicators_oscillators/#moving-averages).
#### Further information
#### Usage
```csharp
KAMA(int fast, int period, int slow)
KAMA(IDataSeries inSeries, int fast, int period, int slow)
KAMA(int fast, int period, int slow)[int barsAgo]
KAMA(IDataSeries inSeries, int fast, int period, int slow)[int barsAgo]
```
#### Return value
**double**
When using this method with an index (e.g. **KAMA**(2,10,30)\[**int** barsAgo] ), the value of the indicator will be issued for the referenced bar.
#### Parameters
inSeries Input data series for the indicator
period Number of bars included in the calculations
fast Short period
slow Long period
#### Visualization
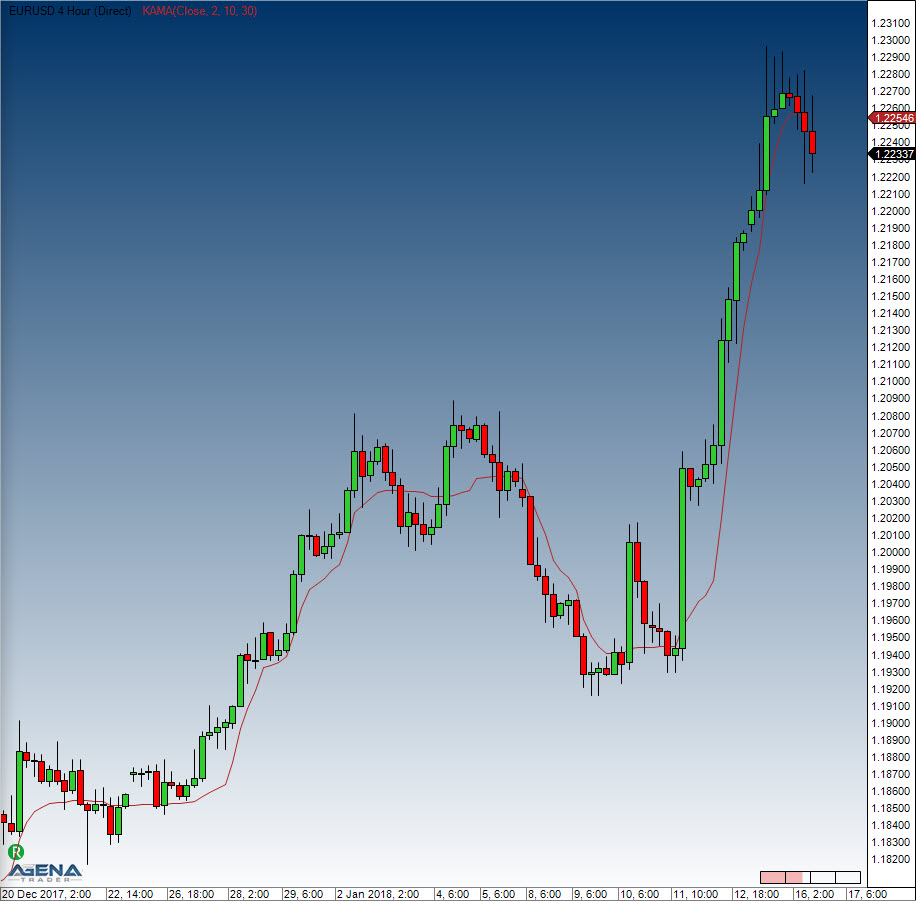
#### Example
```csharp
//Output for the value of the Kaufman Moving Average(KAMA)
Print("The current value of the KAMA is " + KAMA(2,10,30)[0]);
```
# MAMA - Mesa Adaptive Moving Average
#### Description
This automatically adapting moving average has a period length that is determined by means of various complex calculations. This complex indicator has its origins in publications by John Ehlers. Ehlers calculates cycles for the price movements to determine the length and intensity of single trend phases. Working with the length of the cycles, the weighting factor for the moving average can be established in several different ways.
**FAMA** This indicator is a second line – the name FAMA can be found in various publications. This line is similar to the underlying exponential moving average and can be used as a trigger line.
#### Interpretation
For more concise information, we recommend that you read Ehler’s paper.
General information about moving averages can be found here: [*Moving Averages*](https://agenatrader.github.io/AgenaIndicator-documentation/indicators_oscillators/#moving-averages).
#### Further information
#### Usage
```csharp
MAMA(double fastLimit, double slowLimit)
MAMA(IDataSeries inSeries, double fastLimit, double slowLimit)
MAMA(double fastLimit, double slowLimit)[int barsAgo]
MAMA(IDataSeries inSeries, double fastLimit, double slowLimit)[int barsAgo]
//Value of the Following Adaptive Moving Average (FAMA)
MAMA(double fastLimit, double slowLimit).Fama[int barsAgo]
MAMA(IDataSeries inSeries, double fastLimit, double slowLimit).Fama[int barsAgo]
```
#### Return value
**double**
When using this method with an index (e.g. **MAMA**(0.5,0.05)\[**int** barsAgo] ), the value of the indicator will be issued for the referenced bar.
#### Parameters
inSeries Input data series for the indicator
fastLimit Upper limit for the alpha value
slowLimit Lower limit for the alpha value
#### Visualization
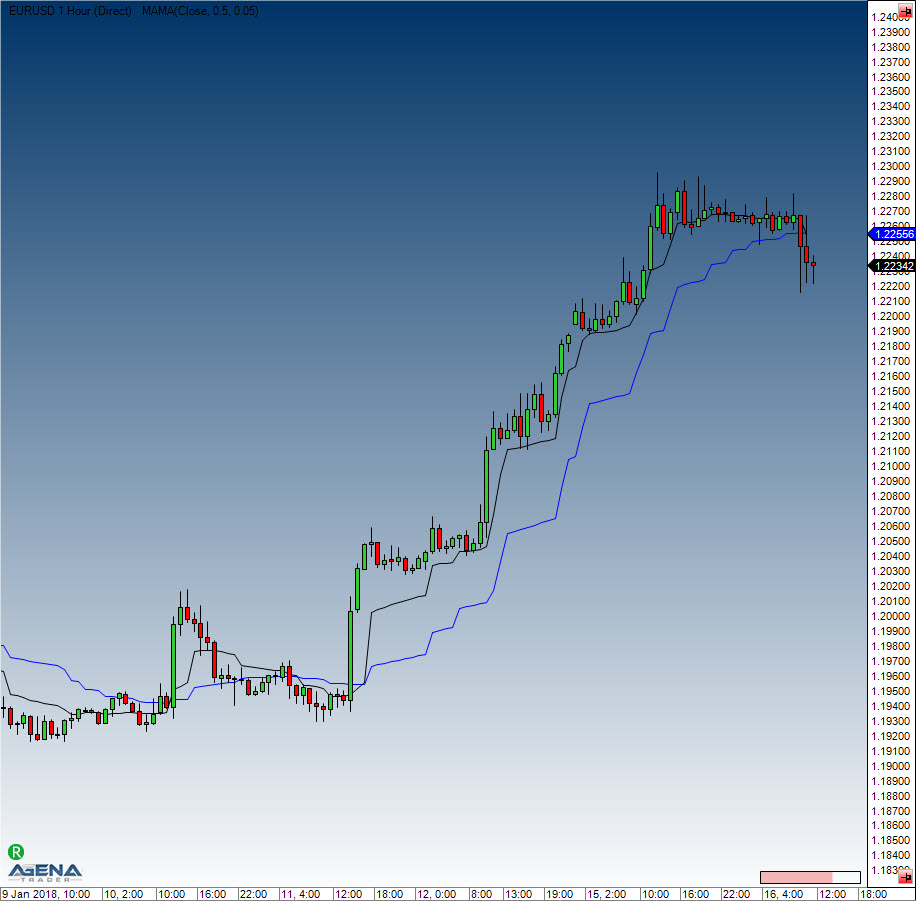
#### Example
```csharp
//Output values for (MAMA)
Print("The current value for the MAMA is " + MAMA(0.5, 0.05)[0]);
//Output values for (FAMA)
Print("The current value for the FAMA is " + MAMA(0.5, 0.05).Fama[0]);
```
# SMA - Simple Moving Average
#### Description
The SMA is the most well-known average, representing the simplest method of displaying the trend direction in a chart. In mathematical terms, this is the arithmetic mean of a number of individual lengths. It is called “moving” because to establish an average, the oldest value is always sacrificed to make space for the new incoming price change. Fundamentally speaking, the period length influences the intensity of the smoothing. Shorter periods (such as 10 days) will mean that the indicator follows the price changes quite closely. The SMA has a few disadvantages, which is why several adaptations of this indicator have been developed in the last few years. One of the biggest disadvantages is the fact that the indicator tends to lag, and the equal weighting for all data inputs across time intervals. You can find more general interpretations and meanings here: [*Moving Averages*](https://agenatrader.github.io/AgenaIndicator-documentation/indicators_oscillators/#moving-averages).
#### Further information
#### Usage
```csharp
SMA(int period)
SMA(IDataSeries InSeries, int period)
SMA(int period)[int barsAgo]
SMA(IDataSeries InSeries, int period)[int barsAgo]
```
#### Return value
**double**
When using this method with an index (e.g. **SMA**(14)\[**int** barsAgo] ), the value of the indicator will be issued for the referenced bar.
#### Parameters
inSeries Input data series for the indicator
period Number of bars included in the calculations
#### Visualization
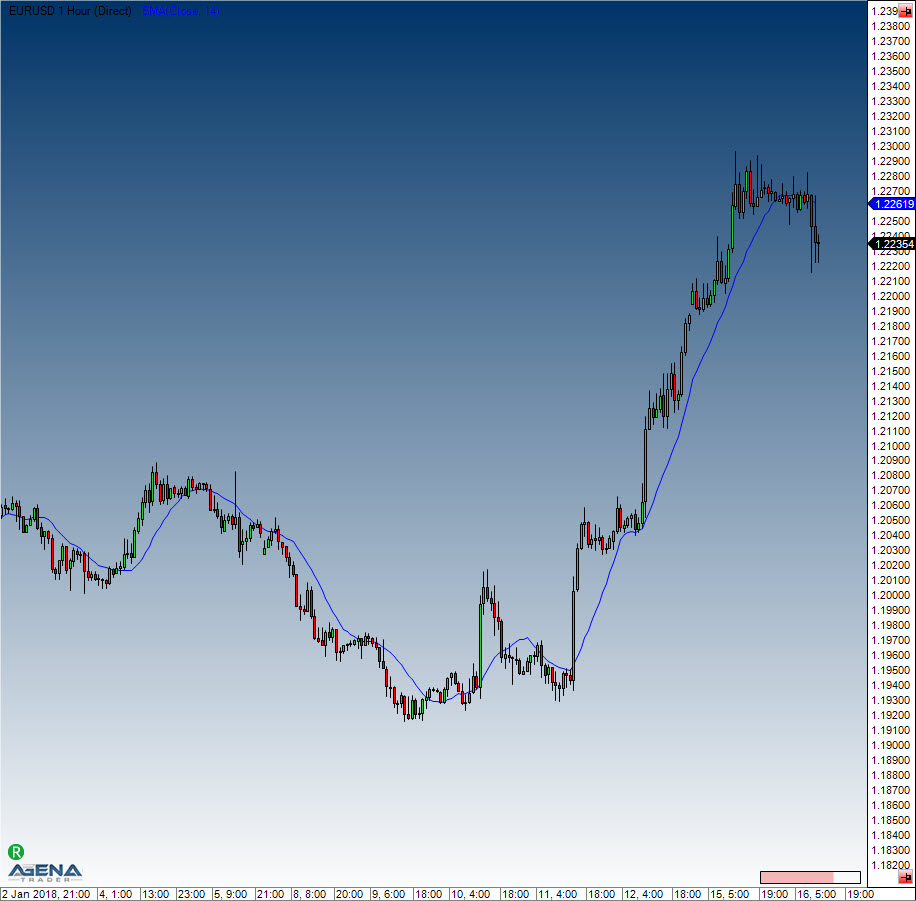
#### Calculation
Value.**Set**((last + InSeries\[0] - InSeries\[Period]) / Math.**Min**(ProcessingBarIndex, Period));
#### Example
```csharp
//Output of the SMA value
Print("The current SMA value is " + SMA(14)[0]);
```
# GapSMA - Gap Simple Moving Average
#### Description
The SimpleSMA has the Issue, that in case of an big opening Gap, the SMA takes very long to adjust to the candles. The GapSMA ignores the Gaps and ends calculating on the Market Close and starts calculating on the Market Open again.
If there is a Gap between the Market Close and the Market Open it will not be taken into account.
#### Usage
```csharp
GapSMA(int period)
GapSMA(IDataSeries InSeries, int period)
GapSMA(int period)[int barsAgo]
GapSMA(IDataSeries InSeries, int period)[int barsAgo]
```
#### Return value
**double**
When using this method with an index (e.g. **GapSMA**(14)\[**int** barsAgo] ), the value of the indicator will be issued for the referenced bar.
#### Parameters
InSeries Input data series for the indicator
period Number of bars included in the calculations
#### Visualization
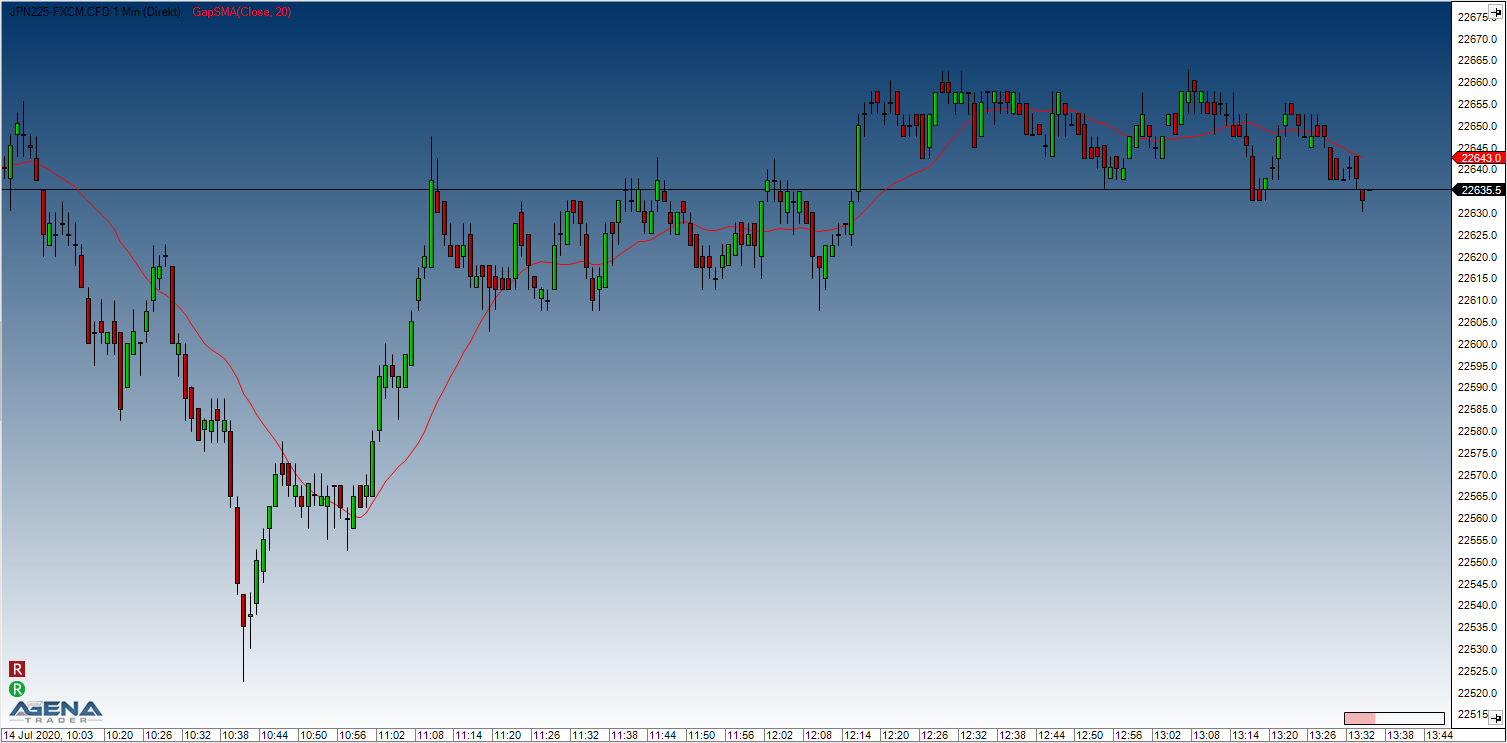
#### Example
```csharp
//Output of the SMA value
Print("The current GapSMA value is " + GapSMA(14)[0]);
```
# SMA MTF (MultiTimeFrame)
#### Description
The SMA MTF – as is true for the other multi-timeframe indicator variations – allows traders to display the SMA of a specific timeframe on a chart of a different timeframe.
See [*BollingerMTF*](https://agenatrader.github.io/AgenaIndicator-documentation/indicators_oscillators/#bollingermtf), [*EmaMTF*](https://agenatrader.github.io/AgenaIndicator-documentation/indicators_oscillators/#ema-mtf-multitimeframe).
#### Visualization
The image shows a 5-minute chart with an SMA (14) calculated on 4-hour bars
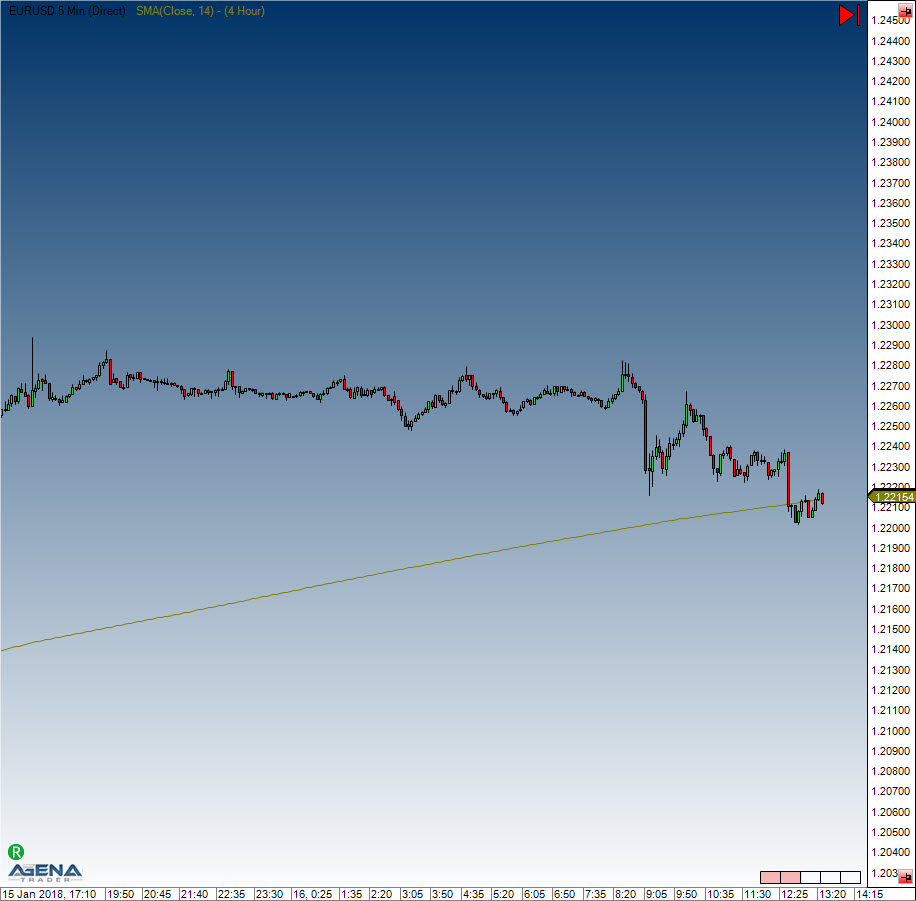
# SMMA - Smoothed Moving Average
#### Description
The Smoothed Moving Average is combined from both Simple Moving Average and the Exponential Moving Average. Generally speaking, it is only used for higher period amounts/inputs. It normally has roughly half of the value of an EMA, meaning that an SMMA(20) is closer to an EMA(40).
#### Interpretation
For more general information about moving averages, please see [*Moving Averages*](https://agenatrader.github.io/AgenaIndicator-documentation/indicators_oscillators/#moving-averages).
The SMMA is often used with the [*SuperTrend*](https://agenatrader.github.io/AgenaIndicator-documentation/indicators_oscillators/#supertrend) indicator.
#### Further information
#### Usage
```csharp
SMMA(int period)
SMMA(IDataSeries inSeries, int period)
SMMA(int period)[int barsAgo]
SMMA(IDataSeries inSeries, int period)[int barsAgo]
```
#### Return value
**double**
When using this method with an index (e.g. **SMMA**(14)\[**int** barsAgo] ), the value of the indicator will be issued for the referenced bar.
#### Parameters
inSeries Input data series for the indicator
period Number of bars included in the calculations
#### Visualization
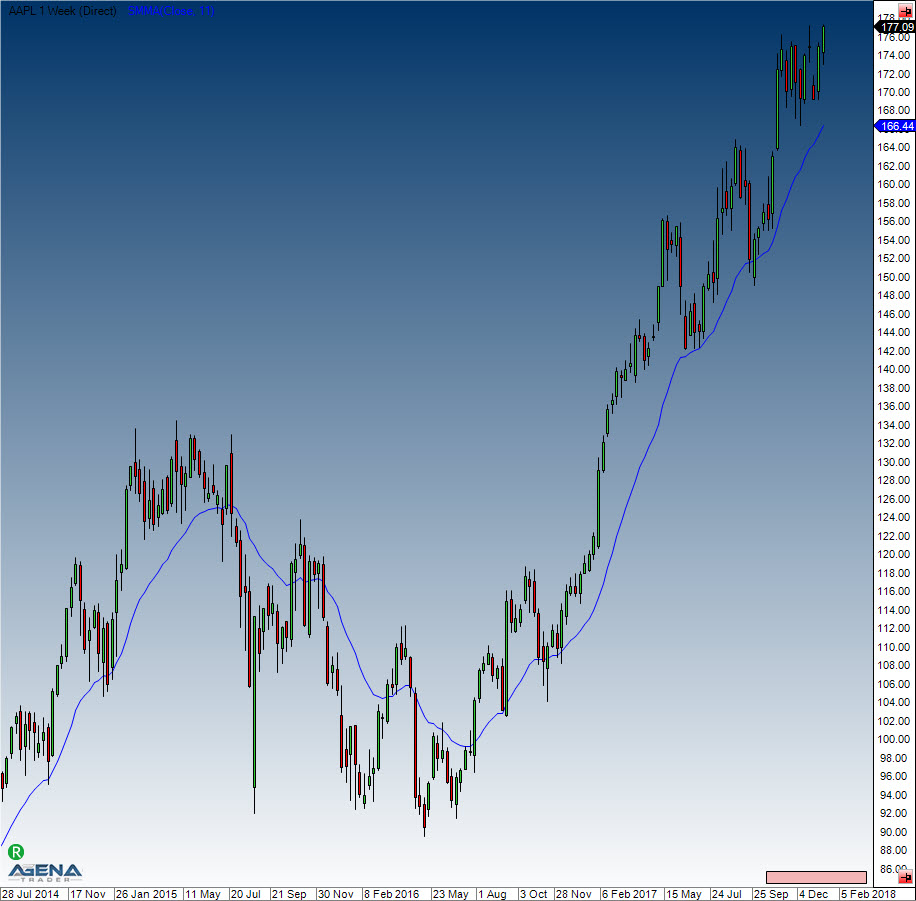
#### Example
```csharp
//Output for the value of the SMMA
Print("The current SMMA value is " + SMMA(14)[0]);
```
# TEMA - Triple Exponential Moving Average
#### Description
The TEMA is combined from a single, a double and a triple EMA. This combo improves the delay between the indicator and price movements. The Triple Exponential Moving Average is quite efficient at smoothing price changes.
You can find more information about moving averages here: [*Moving Averages*](https://agenatrader.github.io/AgenaIndicator-documentation/indicators_oscillators/#moving-averages).
#### Usage
```csharp
TEMA(int period)
TEMA(IDataSeries inSeries, int period)
TEMA(int period)[int barsAgo]
TEMA(IDataSeries inSeries, int period)[int barsAgo]
```
#### Return value
**double**
When using this method with an index (e.g. **TEMA**(14)\[**int** barsAgo] ), the value of the indicator will be issued for the referenced bar.
#### Parameters
inSeries Input data series for the indicator
period Number of bars included in the calculations
#### Visualization
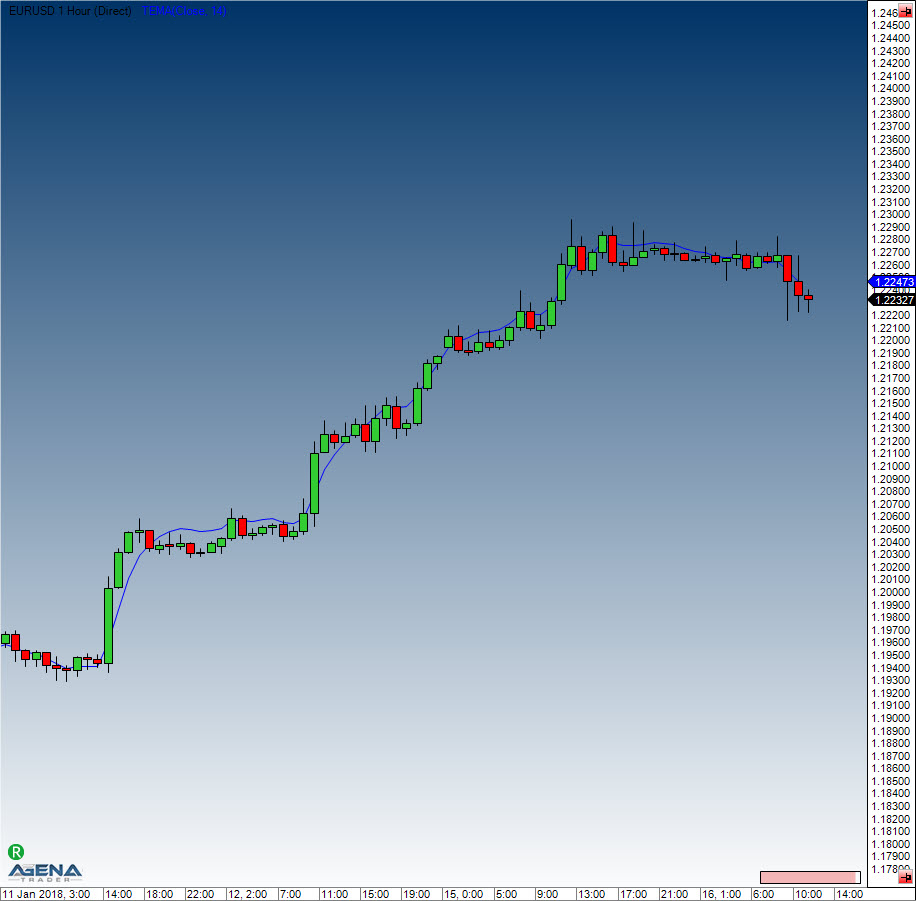
#### Example
```csharp
//Output for the Triple Exponential Moving Average
Print("The current TEMA value is " + TEMA(14)[0]);
```
# TMA - Triangular Moving Average
#### Description
This specifically weighted average has an extra smoothing component. The weightings are not linear, but instead take on a triangular pattern. To demonstrate, the weighting for a 7-period average would be 1,2,3,4,3,2,1. More weight is given to the median value of the time series, and the newest and oldest data is given less weight.
#### Usage
```csharp
TMA(int period)
TMA(IDataSeries inSeries, int period)
TMA(int period)[int barsAgo]
TMA(IDataSeries inSeries, int period)[int barsAgo]
```
#### Return value
**double**
When using this method with an index (e.g. **TMA**(14)\[**int** barsAgo] ), the value of the indicator will be issued for the referenced bar.
#### Parameters
inSeries Input data series for the indicator
period Number of bars included in the calculations
#### Visualization
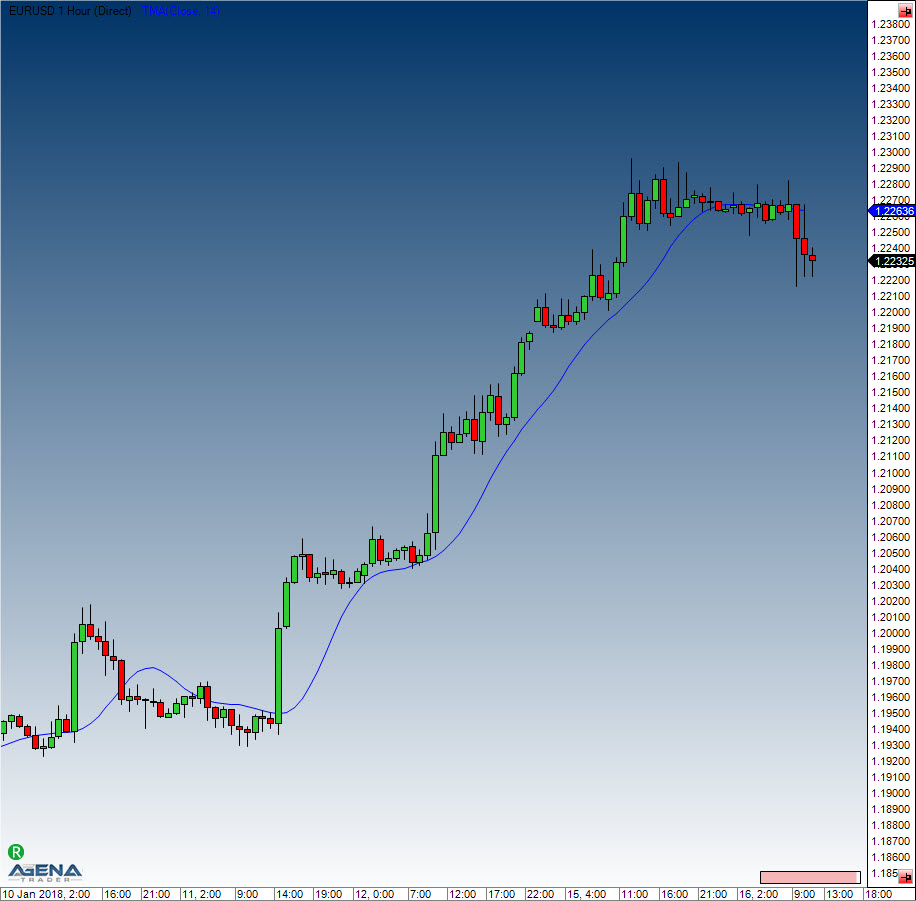
#### Example
```csharp
//Output for the value of the TMA
Print("The current value for the TMA is " + TMA(14)[0]);
```
# TRIX - Triple Exponential Moving Average
#### Description
Jack Hutson developed this TRIX indicator, which is a 1-day rate-of-change indicator. What this means is that day 2 is divided by day 1, day 3 by day 2 and so on and so forth, and this is then applied to a triple exponential moving average of the closing prices. This results in a zero line fluctuating oscillator which is used as trend indicator thanks to its stability.
#### Interpretation
A buy signal is created when the TRIX indicator crosses the zero line from bottom to top. A sell signal is generated when the zero line is broken in a downwards direction.
#### Usage
```csharp
TRIX(int period, int signalPeriod)
TRIX(IDataSeries inSeries, int period, int signalPeriod)
TRIX(int period, int signalPeriod)[int barsAgo]
TRIX(IDataSeries inSeries, int period, int signalPeriod)[int barsAgo]
//For the signal line
TRIX(int period, int signalPeriod).Signal[int barsAgo]
TRIX(IDataSeries inSeries, int period, int signalPeriod).Signal[int barsAgo]
```
#### Return value
**double**
When using this method with an index (e.g. **TRIX**(14, 3)\[**int** barsAgo] ), the value of the indicator will be issued for the referenced bar.
#### Parameters
inSeries Input data series for the indicator
period Number of bars included in the calculations
signal period Number of bars included in the signal line calculation
#### Visualization
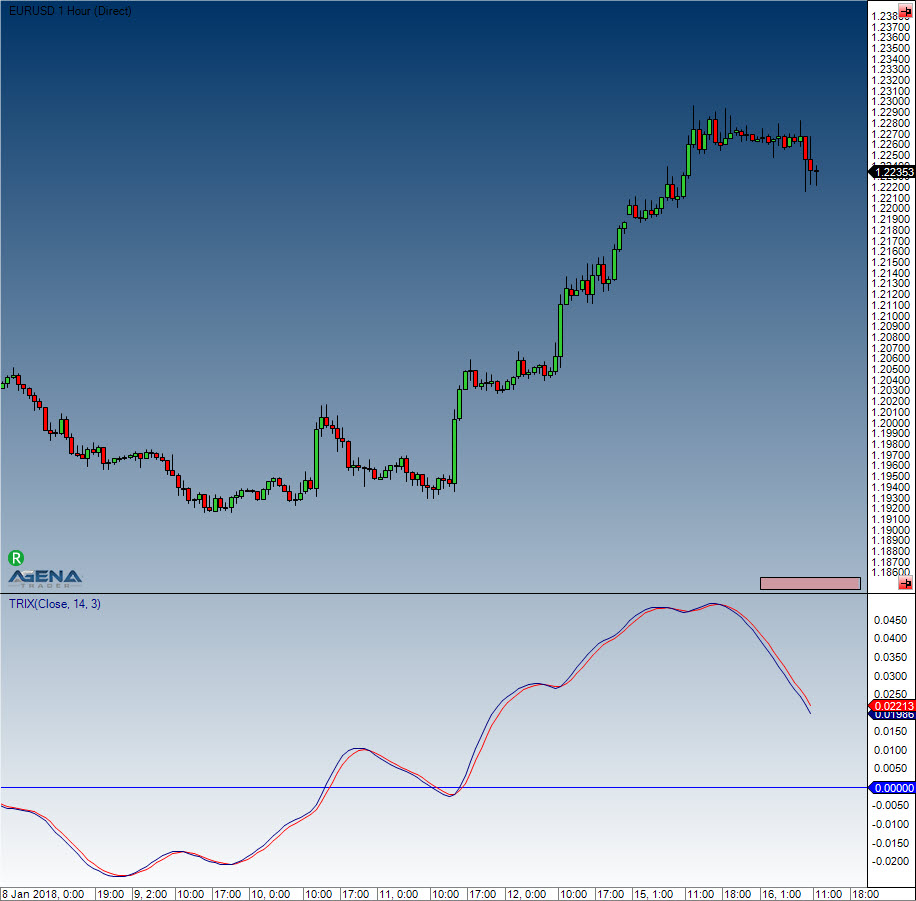
#### Example
```csharp
//Output for the TRIX EMA
Print("The current TRIX value is " + TRIX(14, 3)[0]);
//Output for the TRIX signal line
Print("The current TRIX value is " + TRIX(14, 3).Signal[0]);
```
# T3 - Triple Exponential Moving Average
#### Description
The Triple Exponential Moving Average T3 indicator (also dubbed the T3MA) is calculated by taking the weighted sums of a simple, a double, and a triple EMA. This produces a smooth, soft indicator line. The parameter tCount allows the trader to set the number of reiterations. The calculation is the same as the calculation for the DEMA, with the slight difference that here, a volume factor is also added. It accepts values between 0 and 1 (default: 0.7).
#### Usage
```csharp
T3(int period, int tCount, double vFactor)
T3(IDataSeries inSeries, int period, int tCount, double vFactor)
T3(int period, int tCount, double vFactor)[int barsAgo]
T3(IDataSeries inSeries, int period, int tCount, double vFactor)[int barsAgo]
```
#### Return value
**double**
When using this method with an index (e.g. **T3**(14,3,0.7)\[**int** barsAgo] ), the value of the indicator will be issued for the referenced bar.
#### Parameters
inSeries Input data series for the indicator
period Number of bars included in the calculations
tCount Number of iterations for the smoothing
vFactor Volume factor (multiplier)
#### Visualization
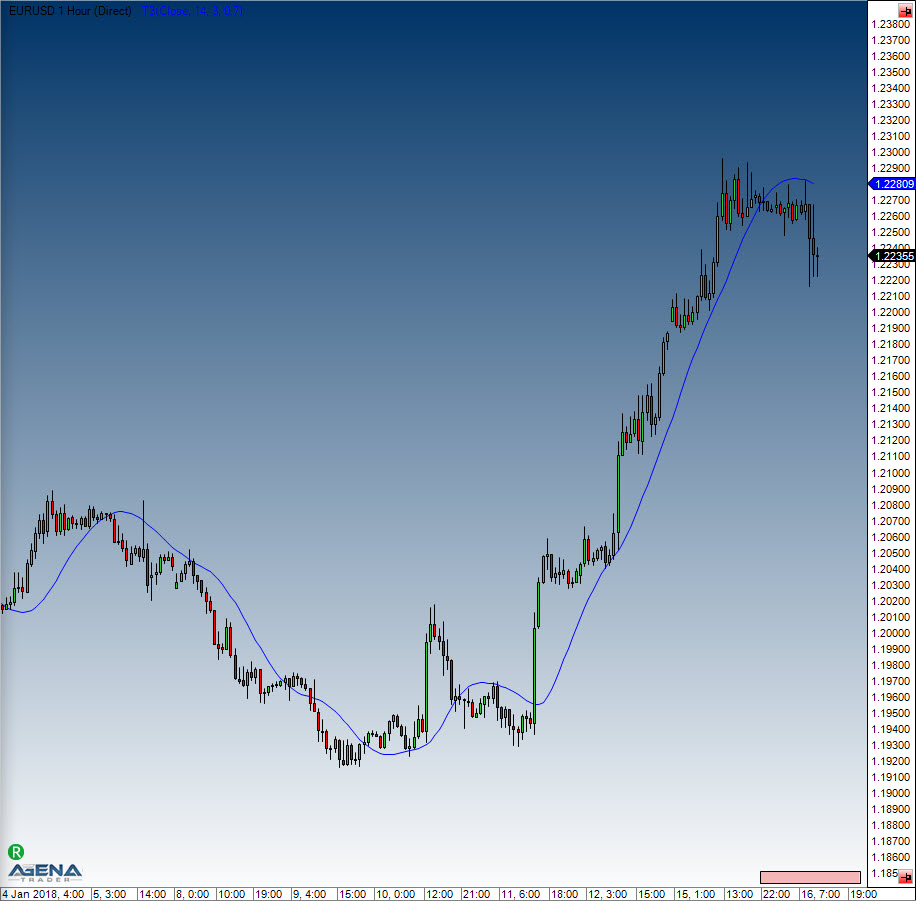
#### Example
```csharp
//Output of the value for the T3 indicator
Print("The current T3 value is " + T3(14, 3, 0.7)[0]);
```
# VMA - Variable Moving Average
#### Description
This variation of an EMA automatically smoothes any fluctuations in the market, and its sensitivity grows as more weight is placed on more recent data.
The VMA attempts to get rid of the disadvantages of other moving averages by automatically regulating the smoothing constant. This is why the VMA can be implemented for most of the market conditions, and is in a few cases actually better than other averages.
**Caution** The VMA is not to be confused with the Volume Moving Average (VolMA)!
#### Usage
```csharp
VMA(int period, int volatilityPeriod)
VMA(IDataSeries inSeries, int period, int volatilityPeriod)
VMA(int period, int volatilityPeriod)[int barsAgo]
VMA(IDataSeries inSeries, int period, int volatilityPeriod)[int barsAgo]
```
#### Return value
**double**
When using this method with an index (e.g. **VMA**(9,9)\[**int** barsAgo] ), the value of the indicator will be issued for the referenced bar.
#### Parameters
inSeries Input data series for the indicator
period Number of bars included in the calculations
volatility period Number of bars included in the calculation for the signal line
#### Visualization
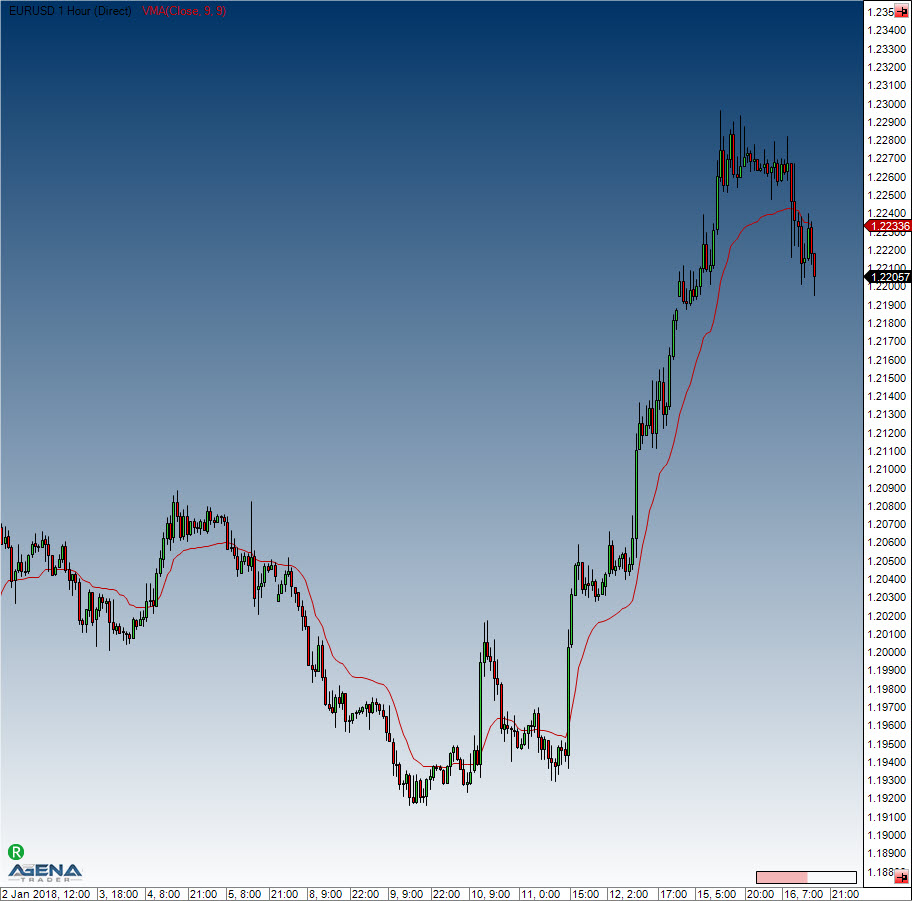
#### Example
```csharp
//Output the VMA value
Print("The current VMA value is " + VMA(9, 9)[0]);
```
# VWMA - Volume Weighted Moving Average
#### Description
VWMA is a non-cumulated smoothed average that is weighted based on the various volumes for the periods.
#### Usage
```csharp
VWMA(int period)
VWMA(IDataSeries inSeries, int period)
VWMA(int period)[int barsAgo]
VWMA(IDataSeries inSeries, int period)[int barsAgo]
```
#### Return value
**double**
When using this method with an index (e.g. **VWMA**(14)\[**int** barsAgo] ), the value of the indicator will be issued for the referenced bar.
#### Parameters
inSeries Input data series for the indicator
period Number of bars included in the calculations
#### Visualization
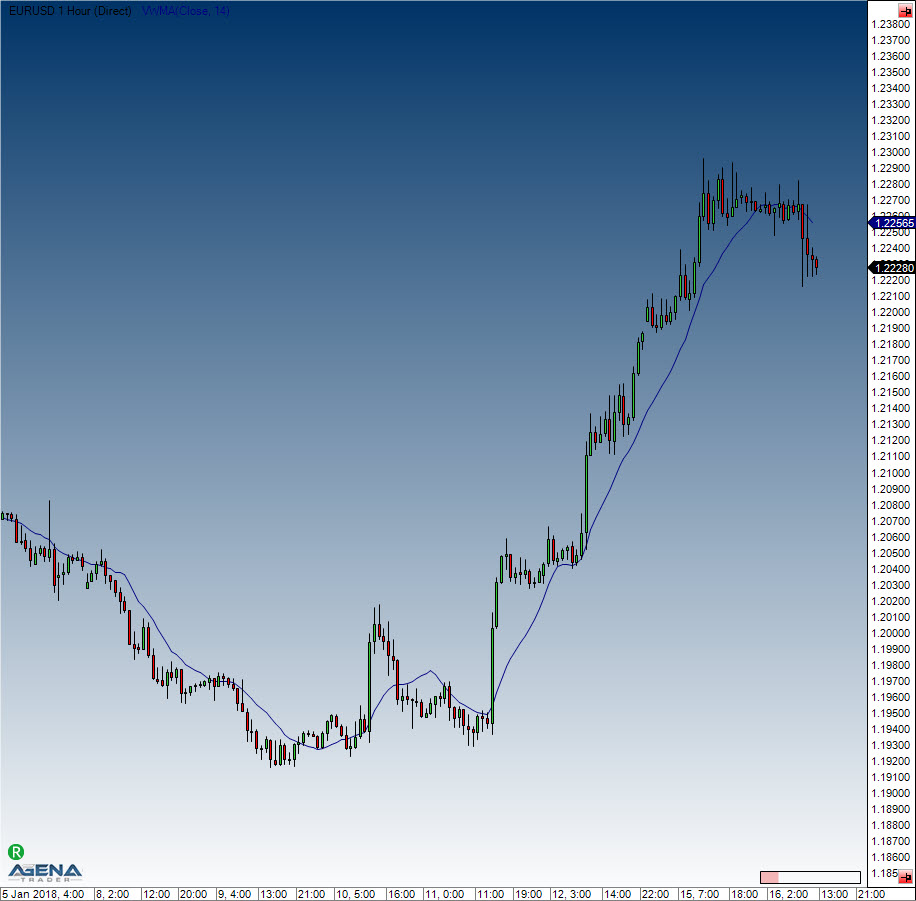
#### Example
```csharp
//Output for the VWMA
Print("The current VWMA value is " + VWMA(14)[0]);
```
# WMA - Weighted Moving Average
#### Description
The Weighted Moving Average is the most well-known of the weighted averages, and is implemented to identify and quickly react to price changes. Current prices are given higher weighting than older ones. In addition, bad signals in sideways markets are minimized. The WMA smoothes the price changes and makes more efficient trade identification possible.
#### Further information
#### Usage
```csharp
WMA(int period)
WMA(IDataSeries inSeries, int period)
WMA(int period)[int barsAgo]
WMA(IDataSeries inSeries, int period)[int barsAgo]
```
#### Return value
**double**
When using this method with an index (e.g. **WMA**(14)\[**int** barsAgo] ), the value of the indicator will be issued for the referenced bar.
#### Parameters
inSeries Input data series for the indicator
period Number of bars included in the calculations
#### Visualization
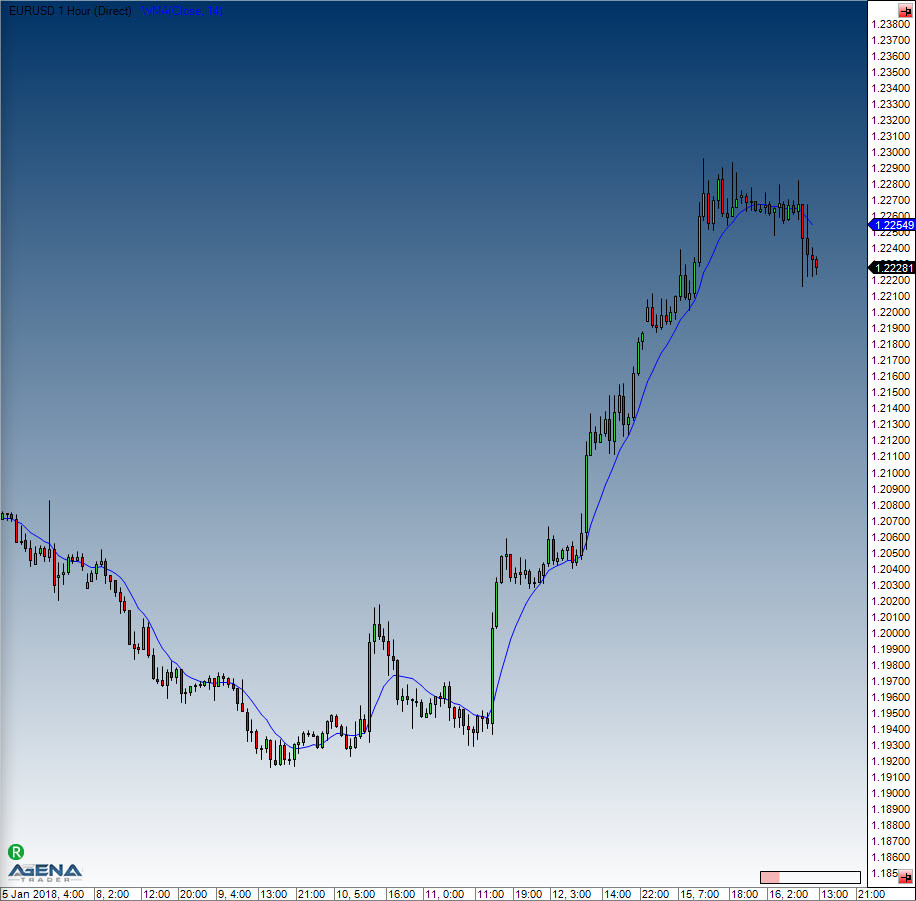
#### Example
```csharp
//Output for the WMA
Print("The current value of the WMA is " + WMA(14)[0]);
```
# ZLEMA - Zero Lag Exponential Moving Average
#### Description
The Zero Lag Exponential Moving Average is another variation of the EMA. Zero lag in this context signifies no delay, which means that the indicator adapts to the price changes more closely. The indicator does so by removing older price data and decreasing the cumulative effect in order to minimize the lag.
#### Further information
FMLabs:
#### Usage
```csharp
ZLEMA(int period)
ZLEMA(IDataSeries inSeries, int period)
ZLEMA(int period)[int barsAgo]
ZLEMA(IDataSeries inSeries, int period)[int barsAgo]
```
#### Return value
**double**
When using this method with an index (e.g. **ZLEMA**(14)\[**int** barsAgo] ), the value of the indicator will be issued for the referenced bar.
#### Parameters
inSeries Input data series for the indicator
period Number of bars included in the calculations
#### Visualization
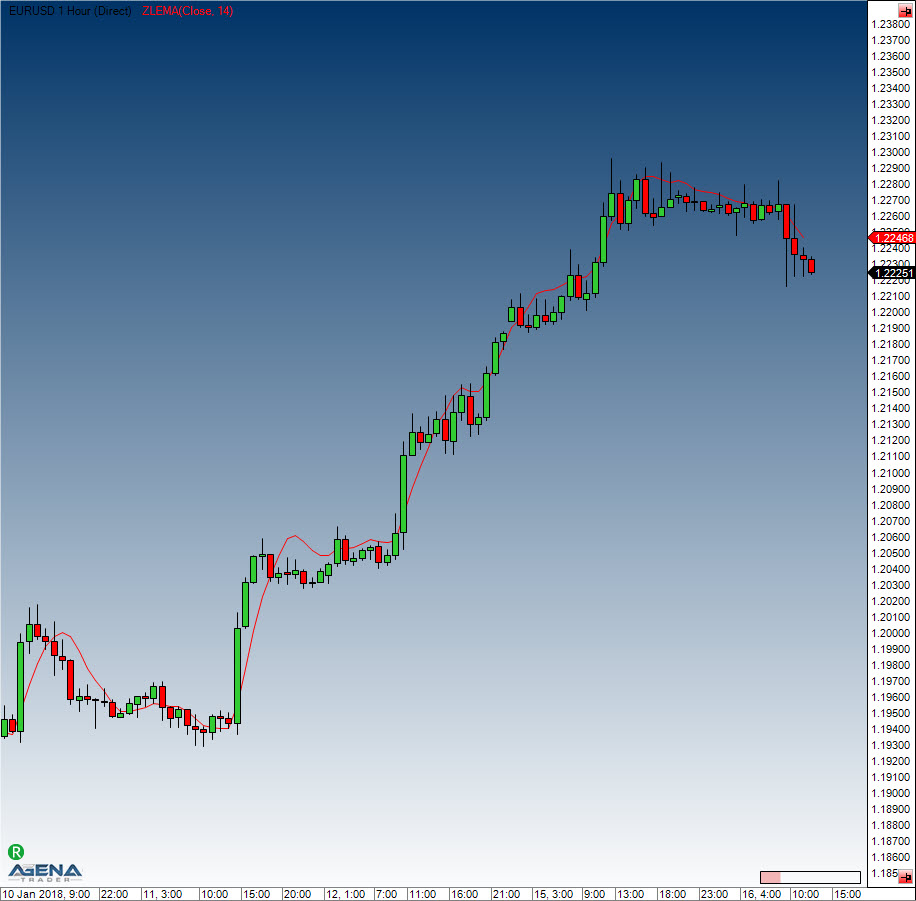
#### Example
```csharp
//Output for the value of the Zero Lag Exponential Moving Average
Print("The current ZLEMA value is " + ZLEMA(14)[0]);
```
# nBarsUp
#### Description
The nBarsUp indicator looks for a specified number of rising closing prices. Other conditions can also be added to the search, for example: Constantly rising bars, i.e. close < open (red candles) Constantly rising highs Constantly rising lows
#### Usage
```csharp
NBarsUp(int barCount, bool BarUp, bool higherHigh, bool higherLow)
NBarsUp(IDataSeries inSeries, int barCount, bool BarUp, bool higherHigh, bool higherLow)
NBarsUp(int barCount, int barCount, bool BarUp, bool higherHigh, bool higherLow)[int barsAgo]
NBarsUp(IDataSeries inSeries, int barCount, bool BarUp, bool higherHigh, bool higherLow)[int barsAgo]
```
#### Return value
**double**
When using this method with an index (e.g. **NBarsUp**(...)\[**int** barsAgo] ), the value of the indicator will be issued for the referenced bar.
1 – The condition applies 0 – The condition does not apply
#### Parameters
inSeries Input data series for the indicator
barCount Number of successively rising closing prices
barUp Additional condition (true): each close must be higher than the open (green bar)
higherHigh Additional condition (true): continuously rising highs
higherLow Additional condition (true): continuously rising lows
#### Visualization
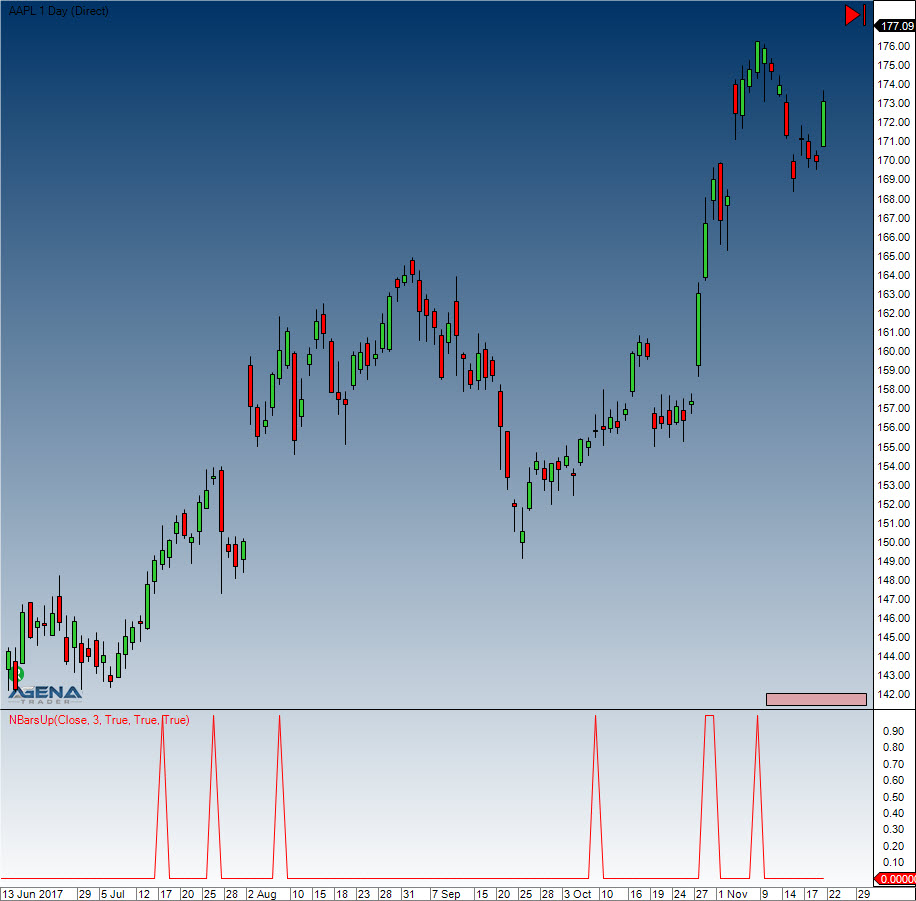
#### Example
```csharp
// Look for 3 successively rising closing prices
if (NBarsUp(3, true, true, true)[0] == 1)
Print("3 successively higher closing prices have occurred.");
```
# nBarsDown
#### Description
The nBarsDown indicator looks for a specified number of falling closing prices.
The following conditions can also be included in the search: - Constantly falling bars - Constantly falling highs - Constantly falling lows
#### Usage
```csharp
NBarsDown(int barCount, bool BarDown, bool lowerHigh, bool lowerLow)
NBarsDown(IDataSeries inSeries, int barCount, bool BarDown, bool lowerHigh, bool lowerLow)
NBarsDown(int barCount, bool BarDown, bool lowerHigh, bool lowerLow)[int barsAgo]
NBarsDown(IDataSeries inSeries, bool barCount, int BarDown, bool lowerHigh, bool lowerLow)[int barsAgo]
```
#### Return value
**double**
When using this method with an index (e.g. **NBarsDown**(...)\[**int** barsAgo] ), the value of the indicator will be issued for the referenced bar.
1 – The condition applies 0 – The condition does not apply
#### Parameters
inSeries Input data series for the indicator
barCount Required number of successively lower closing prices
barDown Additional condition (true): each close must be lower than the open
lowerHigh Additional condition (true): continuously falling highs
lowerLow Additional condition (true); continuously falling lows
#### Visualization
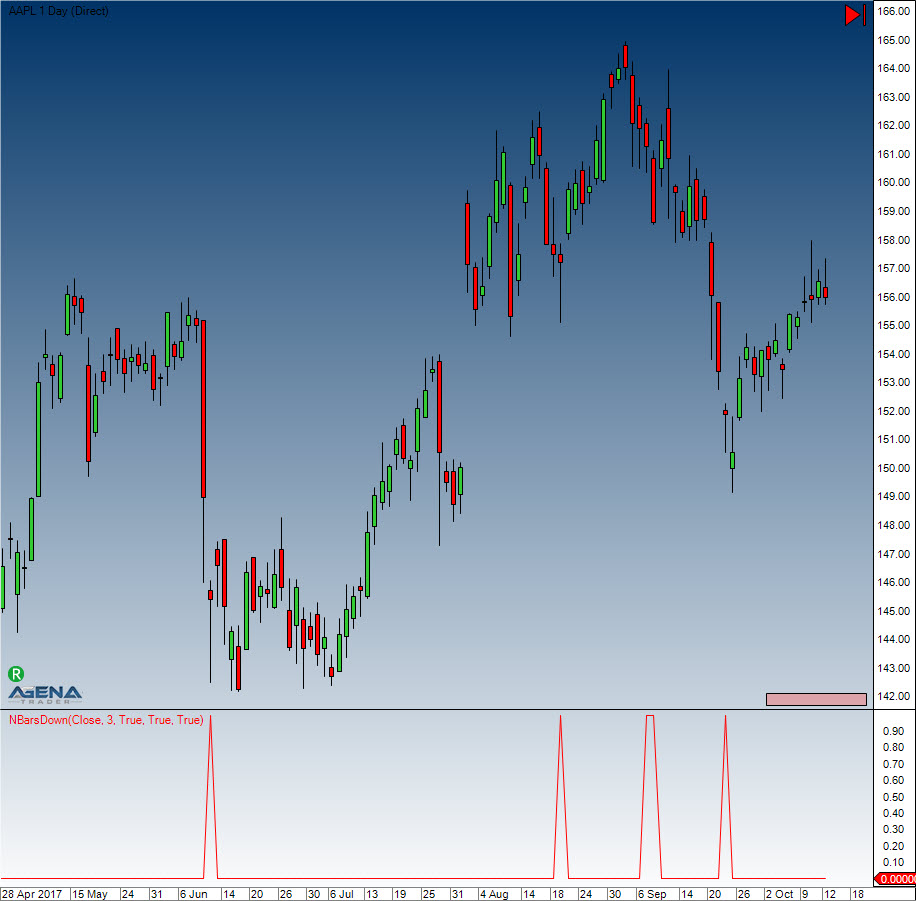
#### Example
```csharp
NBarsDown(int barCount, bool BarDown, bool lowerHigh, bool lowerLow)
NBarsDown(IDataSeries inSeries, int barCount, bool BarDown, bool lowerHigh, bool lowerLow)
NBarsDown(int barCount, bool BarDown, bool lowerHigh, bool lowerLow)[int barsAgo]
NBarsDown(IDataSeries inSeries, bool barCount, int BarDown, bool lowerHigh, bool lowerLow)[int barsAgo]
```
# OnBalanceVolume (OBV)
#### Description
This indicator displays the buy or sell pressure. For each day with a positive close, the volume is added cumulatively, and it is subtracted for days with a close that is smaller than the open.
#### Interpretation
Granville theorized that volume precedes price. OBV rises when volume on up days outpaces volume on down days. OBV falls when volume on down days is stronger. A rising OBV reflects positive volume pressure that can lead to higher prices. Conversely, falling OBV reflects negative volume pressure that can foreshadow lower prices. Granville noted in his research that OBV would often move before price. Expect prices to move higher if OBV is rising while prices are either flat or moving down. Expect prices to move lower if OBV is falling while prices are either flat or moving up.
The absolute value of OBV is not important. Chartists should instead focus on the characteristics of the OBV line. First define the trend for OBV. Second, determine if the current trend matches the trend for the underlying security. Third, look for potential support or resistance levels. Once broken, the trend for OBV will change and these breaks can be used to generate signals. Also notice that OBV is based on closing prices. Therefore, closing prices should be considered when looking for divergences or support/resistance breaks. And finally, volume spikes can sometimes throw off the indicator by causing a sharp move that will require a settling period. (Source: Stockcharts.com)
#### Usage
```csharp
OBV()
OBV(IDataSeries inSeries)
OBV()[int barsAgo]
OBV(IDataSeries inSeries)[int barsAgo]
```
#### Return value
**double**
When using this method with an index (e.g. **OBV**()\[**int** barsAgo] ), the value of the indicator will be issued for the referenced bar.
#### Parameter
inSeries Input data series for the indicator
#### Visualization
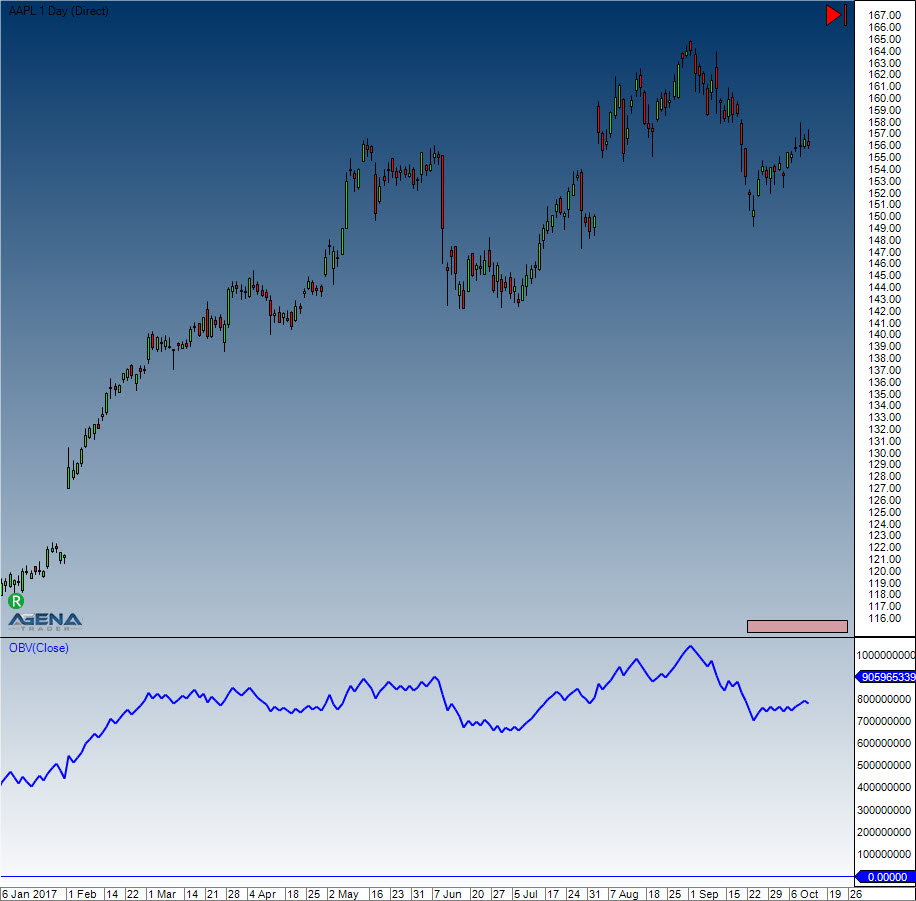
#### Example
```csharp
//Output the value for the On Balance Volume (OBV)
Print("The current value for the OBV is " + OBV()[0]);
```
# OutsideBars
#### Description
The Outside Bars indicator is in fact an outdated version of the [*InsideBarsMT*](https://agenatrader.github.io/AgenaIndicator-documentation/indicators_oscillators/#insidebarsmt).
# Parabolic SAR
#### Description
Welles Wilder came up with the Parabolic SAR, which denotes a price and time-based trading system. Wilder named this the "Parabolic Time/Price System." SAR signifies "stop and reverse," which is the name of the actual indicator used in his system, where **SAR trails price as the trend extends over time**. When prices are rising, the indicator is below them, and when prices are falling, it is above them. Therefore the indicator stops and reverses when the price trend reverses and breaks either above or below the indicator.
Wilder used his new book, New Concepts in Technical Trading Systems, to introduce the Parabolic Time/Price System in 1978. The book also discusses RSI, Average True Range, and the Directional Movement Concept (ADX). Although they were created before the computer age, Wilder's indicators function equally well today and have a high reputation.
SAR follows the price, and can be considered a trend-following indicator. If a downtrend reverses and starts up, SAR follows the prices just like a trailing stop. This stop continues to rise so long as the uptrend remains intact, which means that the SAR never decreases in an uptrend and is always protecting profits as prices move forwards. Once the price stops rising and reverses below SAR, a downtrend starts and SAR is above the price. SAR follows prices lower like a trailing stop, as mentioned before. The stop continuously falls as long as the downtrend continues to exist. Due to the fact that SAR never rises in a downtrend, it always protects profits on short positions.
#### Further information
VTAD:
Wikipedia:
#### Usage
```csharp
ParabolicSAR(double acceleration, double accelerationStep, double accelerationMax)
ParabolicSAR(IDataSeries inSeries, double acceleration, double accelerationStep, double accelerationMax)
ParabolicSAR(double acceleration, double accelerationStep, double accelerationMax)[int barsAgo]
ParabolicSAR(IDataSeries inSeries, double acceleration, double accelerationStep, double accelerationMax)[int barsAgo]
```
#### Return value
**double**
When using this method with an index (e.g. **ParabolicSAR**(...)\[**int** barsAgo] ), the value of the indicator will be issued for the referenced bar.
#### Parameters
| | |
| ---------------- | ----------------------------------- |
| acceleration | Acceleration |
| accelerationStep | Increment of the acceleration |
| accelerationMax | Maximum acceleration |
| InSeries | Input data series for the indicator |
#### Visualization
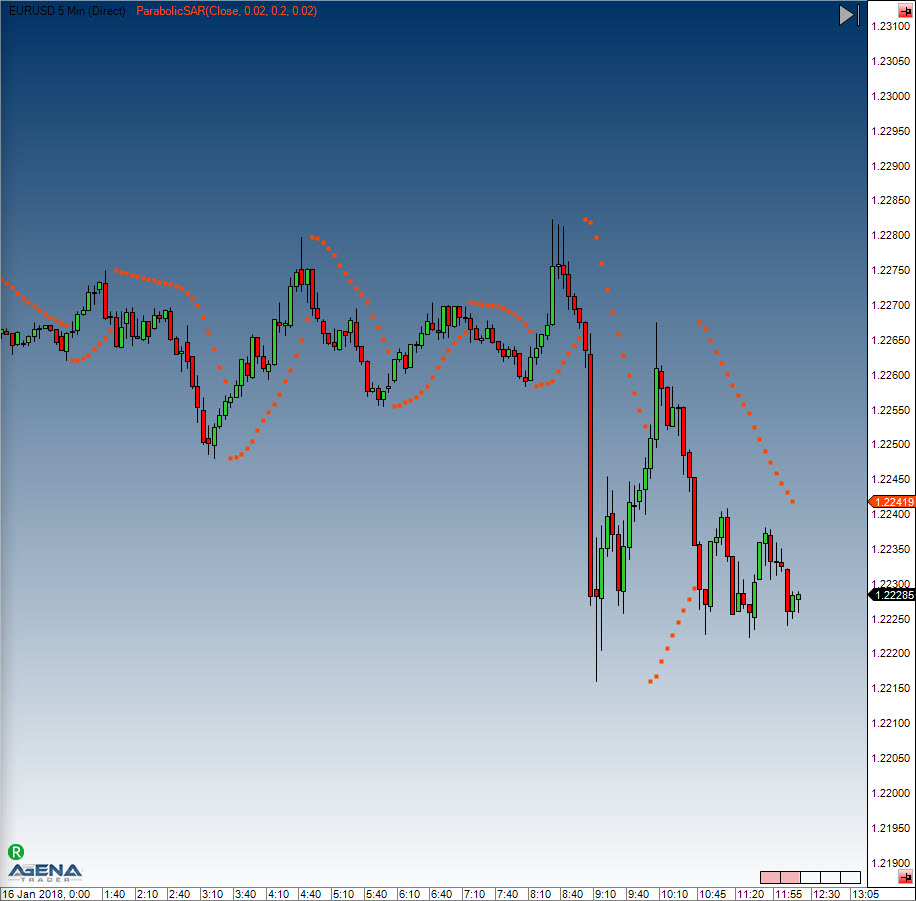
#### Example
```csharp
//Output of the value for the PSAR
Print("The current value for the Parabolic SAR is " + ParabolicSAR(0.02, 0.2, 0.02)[0]);
```
# Percentage Price Oscillator (PPO)
#### Description
The Percentage Price Oscillator displays the percentage difference between two moving averages. It is classed as a momentum indicator and is similar to the MACD in its construction.
#### Interpretation
The PPO can be used for divergence analysis. The divergences have the advantage of having a higher percentual hit rate. On the downside, they often appear too early and thus are hard for newer traders to assess properly.
#### Usage
```csharp
PPO(int fast, int slow, int smooth)
PPO(IDataSeries inSeries, int fast, int slow, int smooth)
PPO(int fast, int slow, int smooth)[int barsAgo]
PPO(IDataSeries inSeries, int fast, int slow, int smooth)[int barsAgo]
//For the smoothed value
PPO(int fast, int slow, int smooth).Smoothed[int barsAgo]
PPO(IDataSeries inSeries, int fast, int slow, int smooth).Smoothed[int barsAgo]
```
#### Return value
**double**
When using this method with an index (e.g. **PPO**(12,26,9)\[**int** barsAgo] ), the value of the indicator will be issued for the referenced bar.
#### Parameters
inSeries Input data series for the indicator
fast Number of bars for the calculation of the fast EMA
slow Number of bars for the calculation of the slow EMA
smooth Number of bars for the calculation of the EMA signal line
#### Visualization
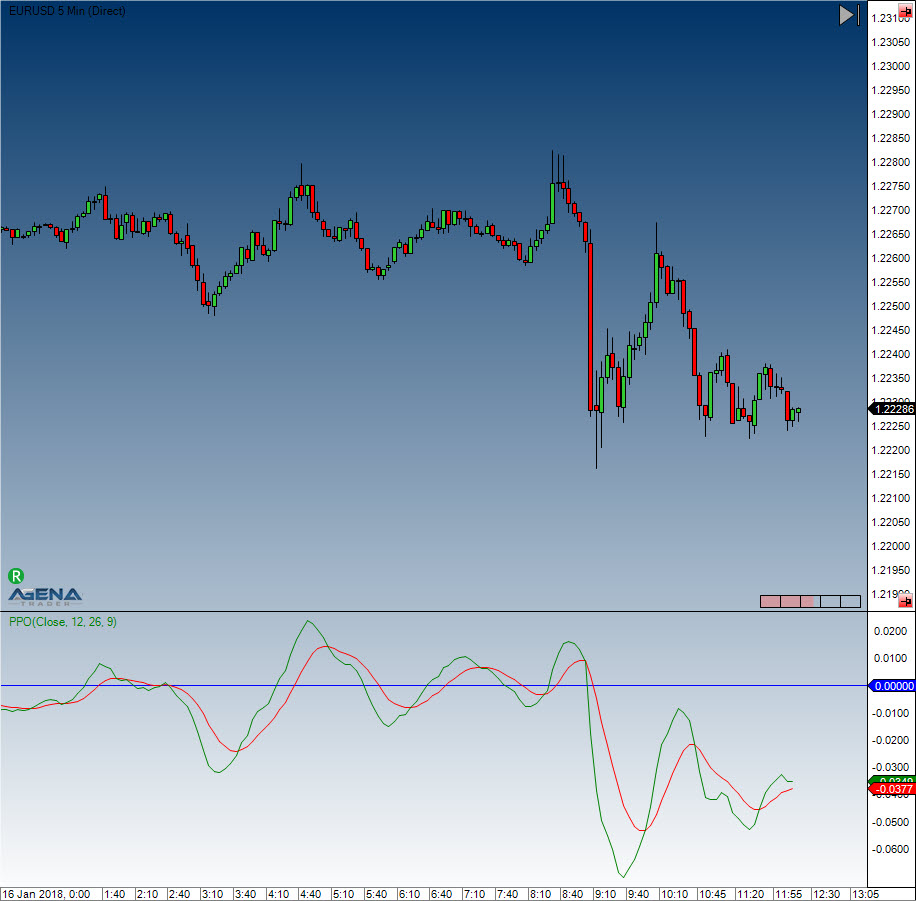
#### Example
```csharp
//Output for the PPO
Print("The current value for the PPO is " + PPO(12, 26, 9)[0]);
//Output for the value of the PPO smoothed
Print("The current value for the PPO is " + PPO(12, 26, 9).Smoothed[0]);
```
# PercentEnvelopes
#### Description
The Percent Envelopes indicator draws an upper and a lower band around a predefined value with a distance of a specified percentage value. The trader can specify which data series the entry value should be (highs, lows, closing price, another indicator etc.).
It is possible to use an SMA as the entry value. In this case, the upper and lower bands will be displayed with a distance of 1.5%.
#### Interpretation
Similarly to the Bollinger Bands, the Percent Envelope indicator can be used to make buy or sell decisions and to determine whether the price is under- or overvalued.
The Percent Envelope should never be used to make decisions based solely on the output, but should be used in conjunction with other indicators to confirm signals.
#### Usage
```csharp
PercentEnvelopes(double percent)
PercentEnvelopes(IDataSeries inSeries, double percent)
//For the upper band
PercentEnvelopes(double percent).UpperPercentBand[int barsAgo]
PercentEnvelopes(IDataSeries inSeries, double percent).UpperPercentBand[int barsAgo]
//For the lower band
PercentEnvelopes(double percent).LowerPercentBand[int barsAgo]
PercentEnvelopes(IDataSeries inSeries, double percent).LowerPercentBand[int barsAgo]
```
#### Return value
**double**
When using this method with an index (e.g. **PercentEnvelopes**(2)\[**int** barsAgo] ), the value of the indicator will be issued for the referenced bar.
#### Parameters
inSeries Input data series for the indicator
percent Difference in % for the bands (from the input value)
#### Visualization
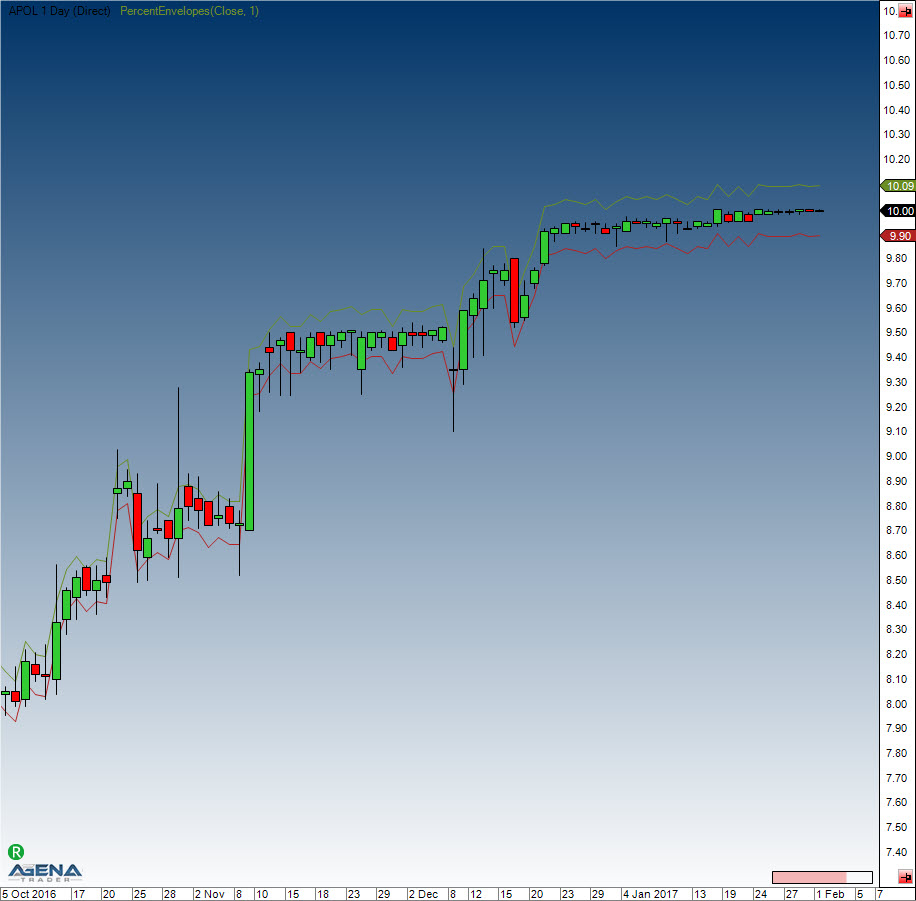
#### Example
```csharp
//Output for the upper band
Print("Value of the upper percent band is: " + PercentEnvelopes(3).UpperPercentBand[0]);
//Output for the lower band
Print("Value of the lower percent band is: " + PercentEnvelopes(3).LowerPercentBand[0]);
```
# Pivot Points
#### Description
This indicator, based on the price zone approach invented by Dr. Bruce Gould, has been honed over the years. In the beginning, the price zones were calculated using the price developments of the last 2-3 years. Nowadays, however, the practical concept of pivot points is taken from the calculation of price zones in the daily chart, using the previous day’s periods as the basis. The goal hereby is to determine price levels that one could use as potential resistance zones (R1..R3) or support zones (S1..S3). The following methods can be used to calculate the indicator: Classic, Floor, Woodie, Camarilla, Fibonacci. The Classic and Floor methods are often wrongly named within literature, which is why in AgenaTrader you will find that the Classic method is labeled as “Floor” and vice versa. The indicator displays the pivot points for intraday charts, and the parameter “ShowPrices” allows you to display the price on the levels. The parameter “DaysBack” allows you to set the number of periods in the past that should be used for the calculation. The line coloring can be defined manually
#### Interpretation
Traders prefer to sell above the resistance lines 1 & 2 (e.g. to build up short positions), and to start building up tactical long positions at the support lines.
#### Further information
#### Usage
```csharp
PivotPoints()
PivotPoints(PivotPointsMode mode)
PivotPoints(PivotPointsMode mode, int LineWidth, bool ShowPrices, int DaysBack, Color RColor, Color PPColor, Color SColor)
PivotPoints(IDataSeries inSeries, PivotPointsMode mode, int LineWidth, bool ShowPrices, int DaysBack, Color RColor, Color PPColor, Color SColor)
PivotPoints()[barsAgo]
PivotPoints(PivotPointsMode mode)[barsAgo]
PivotPoints(PivotPointsMode mode, int LineWidth, bool ShowPrices, int DaysBack, Color RColor, Color PPColor, Color SColor)[barsAgo]
PivotPoints(IDataSeries inSeries, PivotPointsMode mode, int LineWidth, bool ShowPrices, int DaysBack, Color RColor, Color PPColor, Color SColor)[barsAgo]
```
#### Return value
This class has the following public methods (as data series), which all return double values:
**PP, S1, S2, S3, R1, R2 ,R3**
#### Example:
```csharp
PivotPoints().PP[int barsAgo]
PivotPoints(PivotPointsMode.Classic).S3[int barsAgo]
```
#### Parameters
| | |
| ------------------------- | ------------------------------------------------------------------------------------------- |
| InSeries | Input data series for the indicator |
| PivotPointsMode | Calculatory method. Default: floor |
| PivotPointsMode.Classic | |
| PivotPointsMode.Floor | |
| PivotPointsMode.Woodie | |
| PivotPointsMode.Camarilla | |
| PivotPointsMode.Fibonacci | |
| LineWidth | Default: 1 |
| ShowPrices | Shows prices next to the lines. Default:false |
| DaysBack | The number of historical periods to be included in the display of the pivot lines Default:0 |
| RColor | Resistance line color |
| PPColor | Pivot line color |
| SColor | Support line color |
| Show Regions | Color fill space between lines |
| Extend Lines to Future | Extend lines to latest data |
#### Visualization
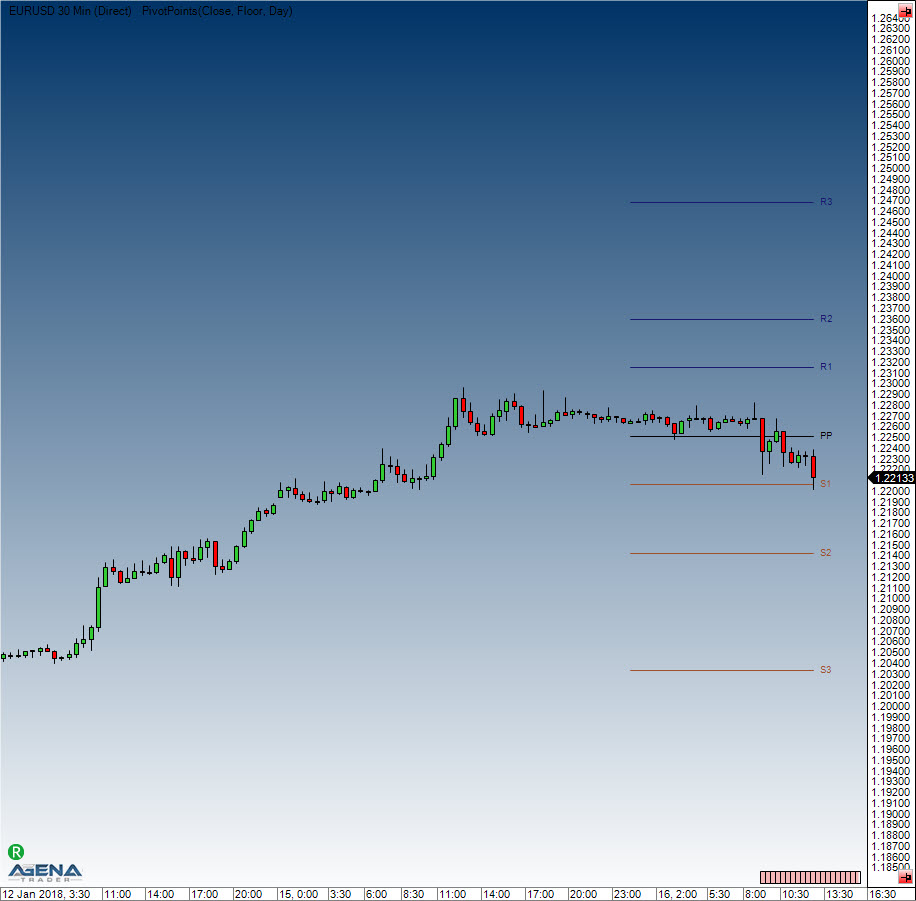
#### Example
```csharp
//Output current pivot point
Print("The floor pivot point is located at: " + PivotPoints()[0]);
//Output first support (S1)
Print("The first pivot support (S1) is at: " + PivotPoints().S1[0]);
```
#### Calculation
H=yesterday’s high, L=yesterday’s low, O=yesterday’s open, C=yesterday’s close
Range = H-L
**Classic**
pp = (H + L + C)/3
r1 = 2\*pp - L
s1 = 2\*pp - H
r2 = pp - s1 + r1
s2 = pp - r1 + s1
r3 = H + 2\*(pp - L)
s3 = L - 2\*(H - pp)
**Floor**
pp = (H + L + C)/3
r1 = 2\*pp - L
s1 = 2\*pp - H
r2 = pp + Range
s2 = pp - Range
r3 = pp + 2\*Range
s3 = pp - 2\*Range
**Woodie**
pp = (H + L + 2\*C)/4
r1 = 2\*pp - L
s1 = 2\*pp - H
r2 = pp + H - L
s2 = pp - H + L
r3 = 0.0
s3 = 0.0
**Camarilla**
pp = (H + L + C)/3
r1 = C + Range \* 1.1 / 12
s1 = C - Range \* 1.1 / 12
r2 = C + Range \* 1.1 / 6
s2 = C - Range \* 1.1 / 6
r3 = C + Range \* 1.1 / 4
s3 = C - Range \* 1.1 / 4
**Fibonacci**
pp = (H + L + C)/3
r1 = pp + 0.382 \* Range
s1 = pp - 0.382 \* Range
r2 = pp + 0.618 \* Range
s2 = pp - 0.618 \* Range
r3 = pp + 0.764 \* Range
s3 = pp - 0.764 \* Range
# Polarized Fractal Efficiency (PFE)
#### Description
Hans Hannula developed the PFE, which is categorized as a momentum indicator. It uses the methods of fractal geometry and chaos theory to determine the price efficiency of the movements.
#### Interpretation
When the PFE zigzags around the zero line, no trend is present. If the PFE is equally formed and running above the zero line, the market is in an uptrend. The higher the value, the stronger the uptrend.
#### Usage
```csharp
PFE(int period)
PFE(IDataSeries inSeries, int period)
PFE(int period)[int barsAgo]
PFE(IDataSeries inSeries, int period)[int barsAgo]
```
#### Return value
**double**
When using this method with an index (e.g. **PFE**(20)\[**int** barsAgo] ), the value of the indicator will be issued for the referenced bar.
#### Parameters
inSeries Input data series for the indicator
period Number of bars included in the calculations
#### Visualization
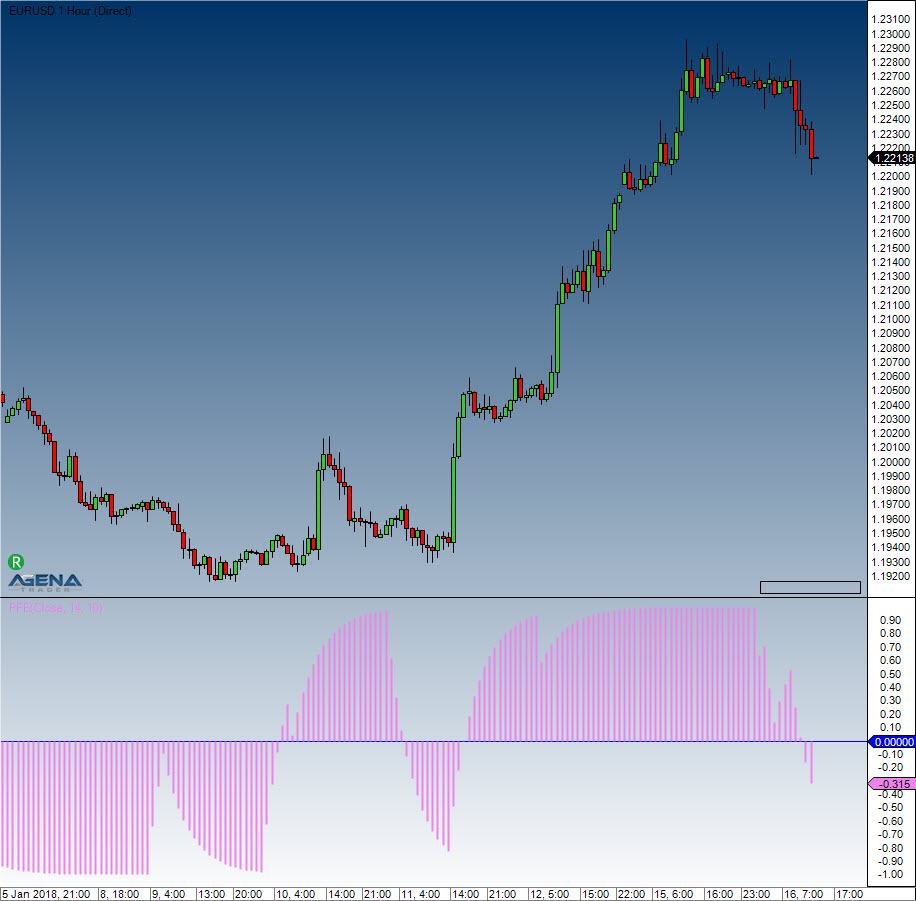
#### Example
```csharp
//Output for the value of the Polarized Fractal Efficiency (PFE)
Print("The current value for the PFE is: " + PFE(20)[0]);
```
# Price Oscillator
#### Description
This indicator is based on the difference between two moving averages. The difference is measured in absolute values, not in percentages.
#### Usage
```csharp
PriceOscillator(int fast, int slow, int smooth)
PriceOscillator(IDataSeries inSeries, int fast, int slow, int smooth)
PriceOscillator(int fast, int slow, int smooth)[int barsAgo]
PriceOscillator(IDataSeries inSeries, int fast, int slow, int smooth)[int barsAgo]
```
#### Return value
**double**
When using this method with an index (e.g. **PriceOscillator**(12,26,9)\[**int** barsAgo] ), the value of the indicator will be issued for the referenced bar.
#### Parameters
inSeries Input data series for the indicator
fast Number of bars used for the calculation of the fast EMA
slow Number of bars used for the calculation of the slow EMA
smooth Number of bars used for the calculation of the EMA signal line
#### Visualization
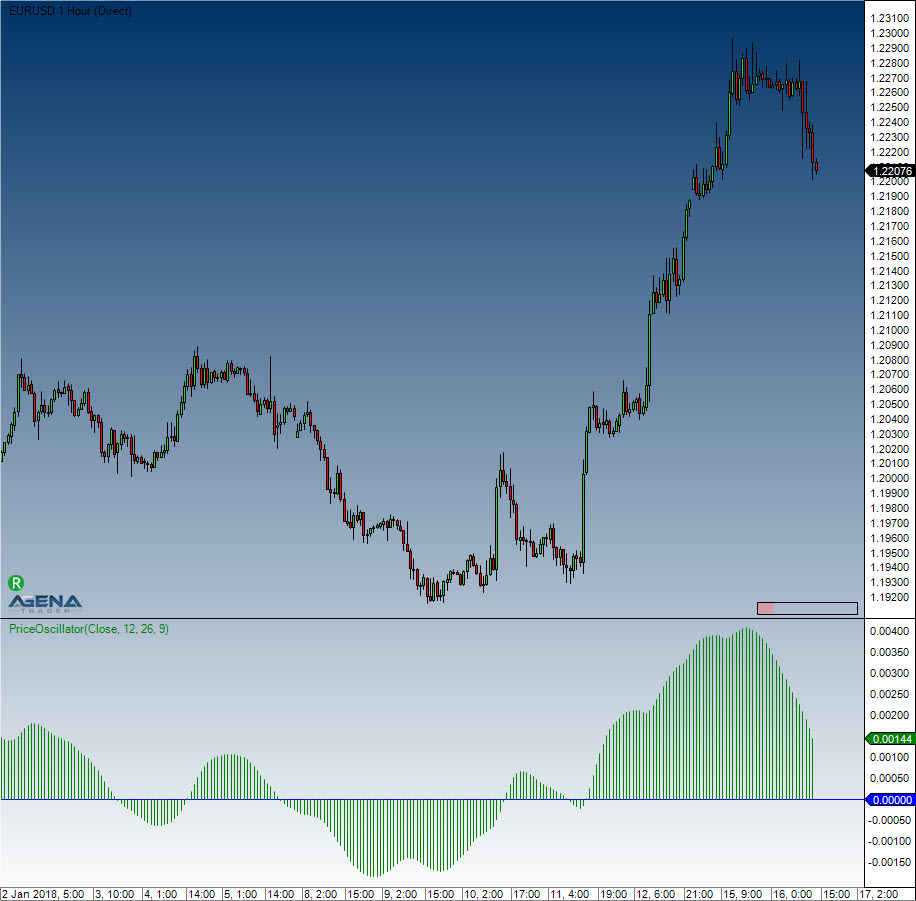
#### Example
```csharp
//Output for the value of the price oscillator
Print("The current value for the PPO is " + PriceOscillator(12, 26, 9)[0]);
//Output for the value of the smooth price oscillator
Print("The current value for the smooth is " + PriceOscillator(12, 26, 9).Smoothed[0]);
```
# Rainbow
#### Description
The rainbow indicator is represented by the set of the moving average indicator lines. Each of these lines is placed closer or further from the chart depending on the time period taken into the account for calculation of moving averages.
#### Introduction
The rainbow indicator has some advantages comparing to the single moving average lines because it shows better, where the trend reversal occurs. When divergence in all lines is substantial - this is a signal of a strong up- or downtrend movement. By default red lines are the closest to the chart and represent the moving average line with the smallest time period. Yellow lines indicate short-term trends. Blue display the area for short-term traders’ activity. Green is typify for medium-term trends. Pink lines can be usefull for traders who hold positions for a long period.
#### Return value
Colors:
Yellow ЕМА: 2,3, 4, 5, 6, 7, 8, 9, 10, 11, 12, 13, 14, 15; Blue ЕМА: 17, 19, 21, 23, 25, 27, 29, 31, 33, 35, 37, 39, 41; Green ЕМА: 44, 47, 50, 53, 56, 59, 62, 65, 68, 71, 74; Red ЕМА: 78, 82, 86, 90, 94, 98, 102, 106, 110, 114, 118, 122; Pink ЕМА: 125, 130, 135, 140, 145, 150, 155, 160, 165, 170, 175, 180, 185, 190, 195, 200.
#### Parameters
| | |
| -------------- | ---------------------------------------------------------------------------------------------------------------------------------------------------------------------------------------------------------------------------------------------------------------------------------- |
| MA Type | Allows to select between the types of the moving average lines that shape a rainbow indicator. Default setting is the EMA (exponential moving average) but it is possible to choose a simple (SMA), hull (HMA) and weighted (WMA) moving average lines |
| Low MA Period | Shows the smallest amount of time periods for which the moving average will be calculated. For example, the setting “2” for the daily chart indicates the two latest daily closing prices. |
| High MA Period | Shows the largest amount of time periods for which the moving average will be calculated. |
| Step | Defines the amount of moving average lines shown on a chart within the rainbow indicator. The smaller is this number the larger amount of lines will be plotted. In our example, step 2 would mean that the indicator will contain 80 EMA lines: EMA(2), EMA(4), EMA(6) and so on. |
#### Visualisation
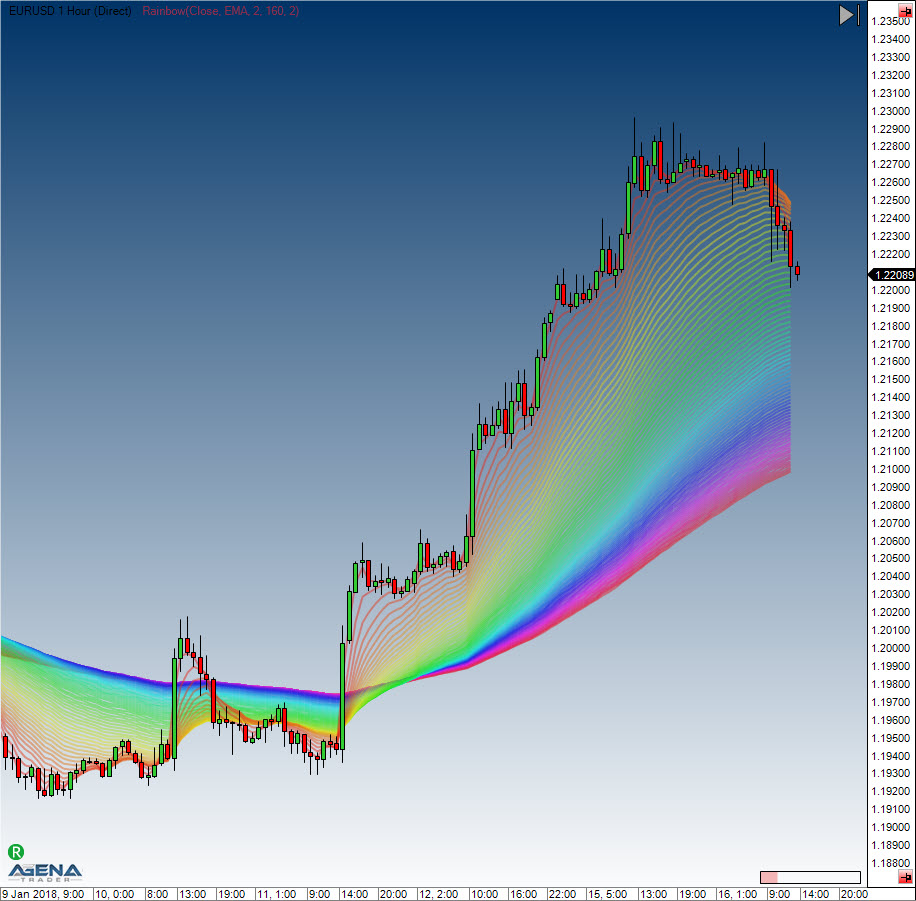
# Range
#### Description
Range delivers the span/difference between the high and low in ticks for each bar. The range is always greater than or equal to 0.
#### Usage
```csharp
Range()
Range(IDataSeries inSeries)
Range()[int barsAgo]
Range(IDataSeries inSeries)[int barsAgo]
```
#### Return value
**double**
When using this method with an index (e.g. **Range**()\[**int** barsAgo] ), the range value for the referenced bar will be outputted.
#### Parameter
inSeries Input data series for the indicator
#### Visualization
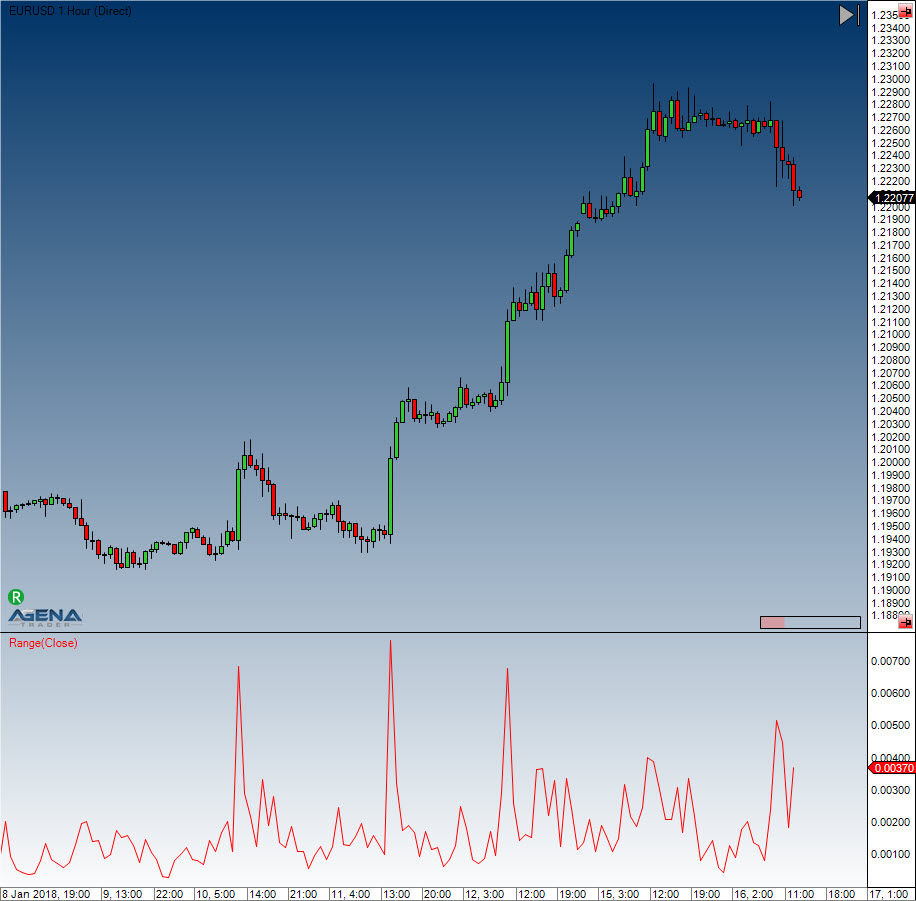
#### Example
```csharp
//Output for the value of the range
Print("The current bar has a range of: " + Range()[0]);
//Identical output
Print("The current bar has a range of: " + High[0] - Low[0]);
```
# Range Indicator (RIND)
#### Description
Jack Weinberg created the Range Indicator (RIND), which was first published in 1954. The RIND compares the intraday span (range) between the high and low to the span (range) between the current closing price and the closing price from the day before.
#### Interpretation
When the span between the current close and the previous days close is bigger than the intraday span between high and low, the indicator will display a high value. This signals a potential trend change...
#### Further information
#### Usage
```csharp
RIND(int periodQ, int smooth)
RIND(IDataSeries inSeries, int periodQ, int smooth)
RIND(int periodQ, int smooth)[int barsAgo]
RIND(IDataSeries inSeries, int periodQ, int smooth)[int barsAgo]
```
#### Return value
**double**
When using this method with an index (e.g. **RIND**(3,10)\[**int** barsAgo] ), the value of the indicator will be issued for the referenced bar.
#### Parameters
inSeries Input data series for the indicator
periodQ Number of bars used for the short-term stochastic
smooth Number of bars used for smoothing the indicator (using an EMA)
#### Visualization
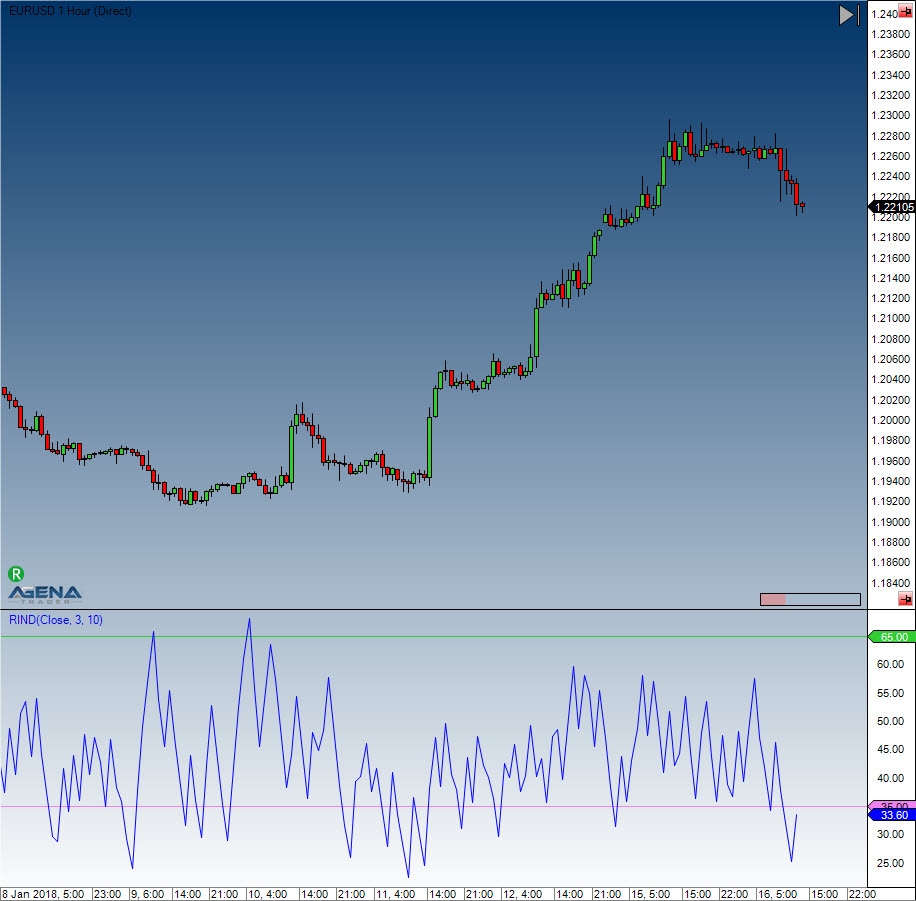
#### Example
```csharp
//Output
Print("The current value for the PFE is: " + RIND(3, 10)[0]);
```
# Rate of Change (ROC)
#### Description
The Rate of Change Indicator is a simple yet effective momentum oscillator. It measures the relative percentage change of the prices from one period to the next. The calculation looks at the current price and compares it to the price of n periods ago.
#### Interpretation
As long as the ROC is above 0, the uptrend is intact. As long as the ROC is below 0, the downtrend is intact. Divergences between the indicator and the price development can hint to a trend change.
#### Further information
VTAD:
#### Usage
```csharp
ROC(int period)
ROC(IDataSeries inSeries, int period)
ROC(int period)[int barsAgo]
ROC(IDataSeries inSeries, int period)[int barsAgo]
```
#### Return value
**double**
When using this method with an index (e.g. **ROC**(14)\[**int** barsAgo] ), the value of the indicator will be issued for the referenced bar.
#### Parameters
inSeries Input data series for the indicator
period Number of bars included in the calculations
#### Visualization
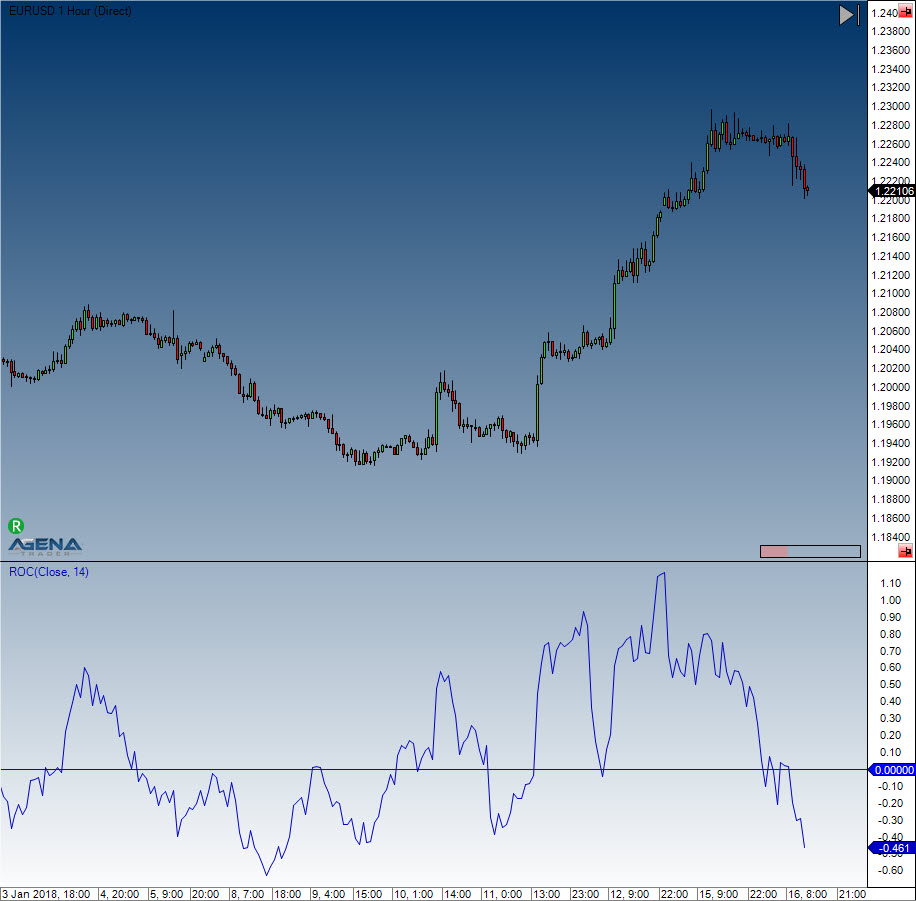
# Relative Performance
#### Description
Calculates the price ratio between current and selected symbols.
#### Further information
#### Usage
```csharp
RelativePerformance (Instrument)
RelativePerformance (Instrument)[int barsAgo]
```
#### Return value
**double**
#### Parameters
IInstrument
#### Visualization
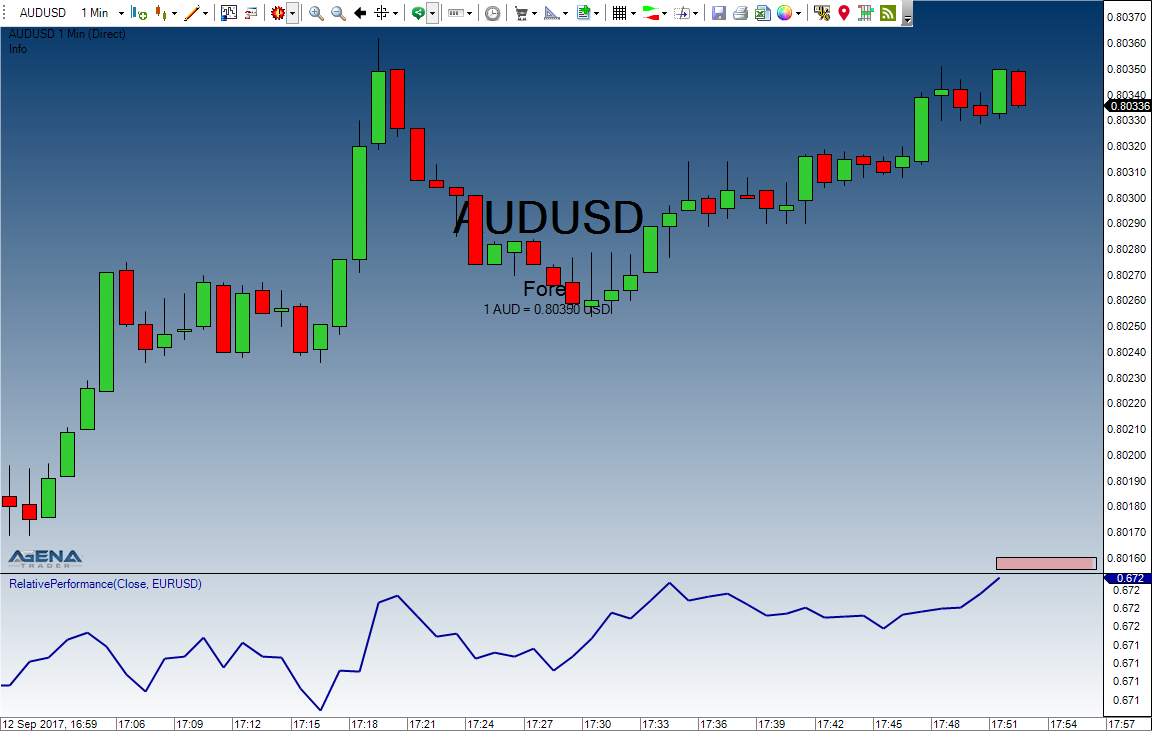
# Relative Spread Strength (RSS)
# Relative Strength Index (RSI)
#### Description
J. Welles Wilder, the creator of several indicators, also developed the RSI, which is one of the most popular, useful momentum oscillators. It compares the size of the most recent profits with the size of the most recent losses, which means that it assesses the relationships between the up and down closing prices. The values are shown between 0 and 100.
#### Interpretation
Traditionally, and according to Wilder, RSI is considered overbought when above 70 and oversold when below 30. Signals can also be generated by searching for divergences, failure swings and centerline crossovers. RSI can also be used to identify the general trend. These traditional levels can also be adjusted to better fit the security or analytical requirements. Raising overbought to 80 or lowering oversold to 20 will reduce the number of overbought/oversold readings. Short-term traders sometimes use 2-period RSI to look for overbought readings above 80 and oversold readings below 20.
#### Further information
#### Usage
```csharp
RSI(int period, int smooth)
RSI(IDataSeries inSeries, int period, int smooth)
RSI(int period, int smooth)[int barsAgo]
RSI(IDataSeries inSeries, int period, int smooth)[int barsAgo]
//For the average value
RSI(int period, int smooth).Avg[int barsAgo]
RSI(IDataSeries inSeries, int period, int smooth).Avg[int barsAgo]
```
#### Return value
**double**
When using this method with an index (e.g. **RSI**(14,3)\[**int** barsAgo] ), the value of the indicator will be issued for the referenced bar.
#### Parameters
inSeries Input data series for the indicator
period Number of bars included in the calculations
smooth Number of periods for the smoothing
#### Visualization
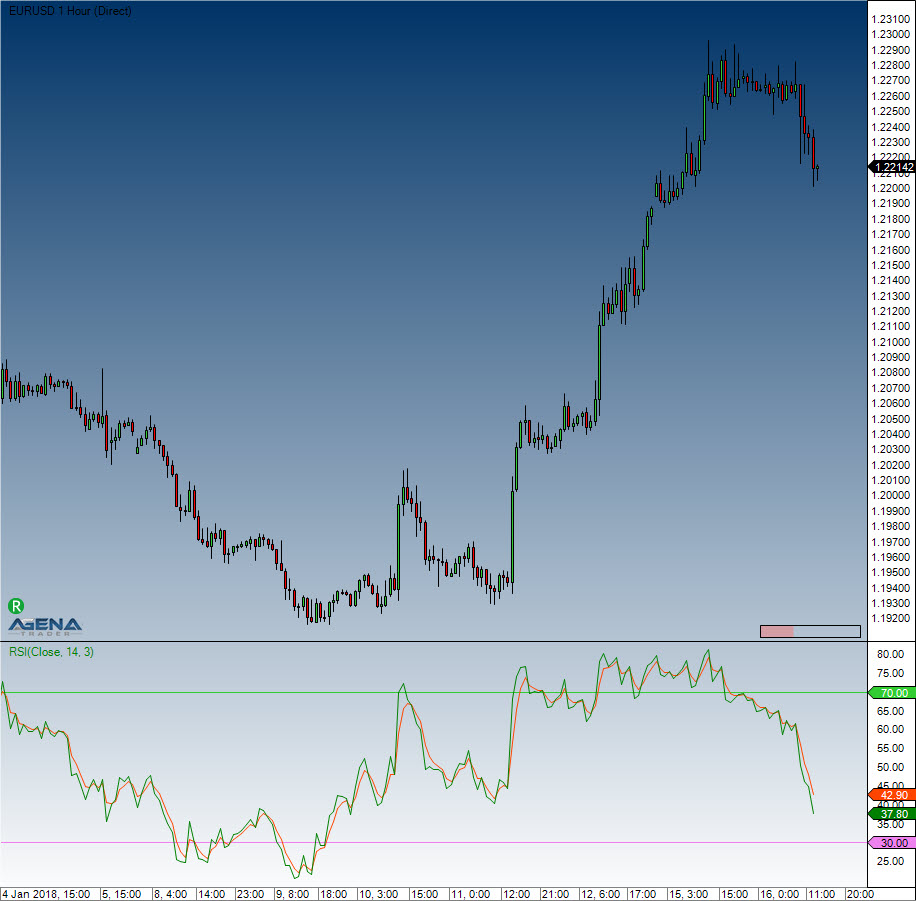
#### Example
```csharp
//Output for the RSI
Print("The current value for the RSI is: " + RSI(14, 3)[0]);
//Output for the average line
Print("The current value for the AVG line is: " + RSI(14, 3).Avg[0]);
```
# Relative Strength Levy (RSL)
#### Description
The concept of the Relative Strength according to R.A. Levy is that the past developments play a very important role in the strength that will be seen in the future. The current performance is compared to the past performance.
The calculation involves taking the weekly closes (or daily closes) and dividing them by the arithmetic mean of the closing prices for the examined period. The result is then balanced around the 10 marker, and an ordered list is created where the value of the highest RSL fills the first place.
#### Usage
```csharp
RSL(int period)
RSLDataSeries inSeries, int period)
RSLnt period)[int barsAgo]
RSL(IDataSeries inSeries, int period)[int barsAgo]
```
#### Return value
**double**
When using this method with an index (e.g. **RSL**(27)\[**int** barsAgo] ), the value of the indicator will be issued for the referenced bar.
#### Parameters
inSeries Input data series for the indicator
period Number of bars included in the calculations
#### Visualization
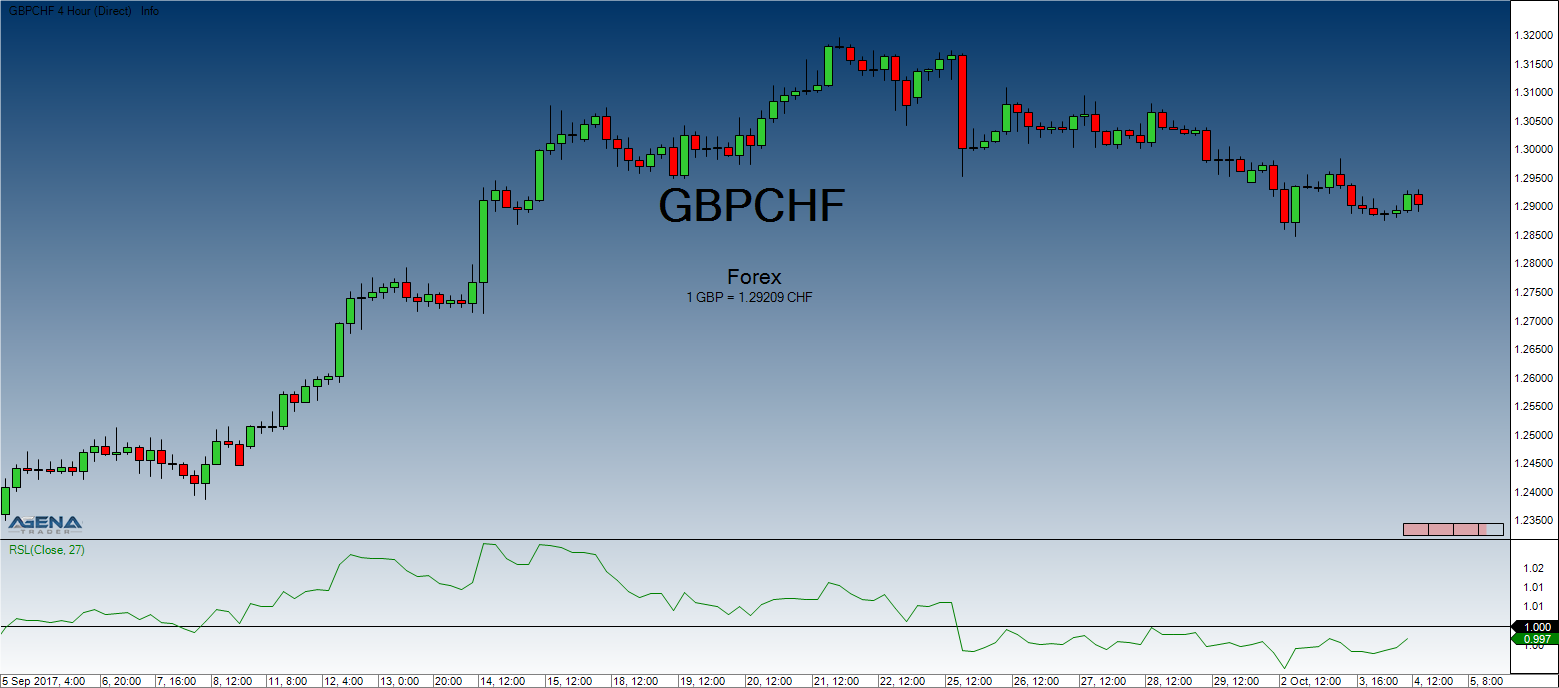
#### Example
```csharp
//RSL value output
Print("The Relative Strength as calculated by Levy is " + RSL(27)[0]);
```
# Relative Volatility Index (RVI)
#### Description
The Relative Volatility Index (RVI) has many similarities to the RSI indicator. Donald Dorsey developed the RVI, which uses the standard deviation instead of the daily price span. To determine the underlying volatility of the instrument, the RVI uses the standard deviation over a period of 10. The RSI indicator is then used on the results, which normalizes them. What comes from this is displayed on a scale of 1 to 100.
#### Interpretation
Values above 50 assume an increase in volatility. Values below 50 imply a drop in volatility. Dorsey recommends using the indicator as a filter for other indicators.
#### Further information
#### Usage
```csharp
RVI(int period)
RVI(IDataSeries inSeries, int period)
RVI(int period)[int barsAgo]
RVI(IDataSeries inSeries, int period)[int barsAgo]
```
#### Return value
**double**
When using this method with an index (e.g. **RVI**(14)\[**int** barsAgo] ), the value of the indicator will be issued for the referenced bar.
#### Parameters
inSeries Input data series for the indicator
period Number of bars included in the calculations
#### Visualization
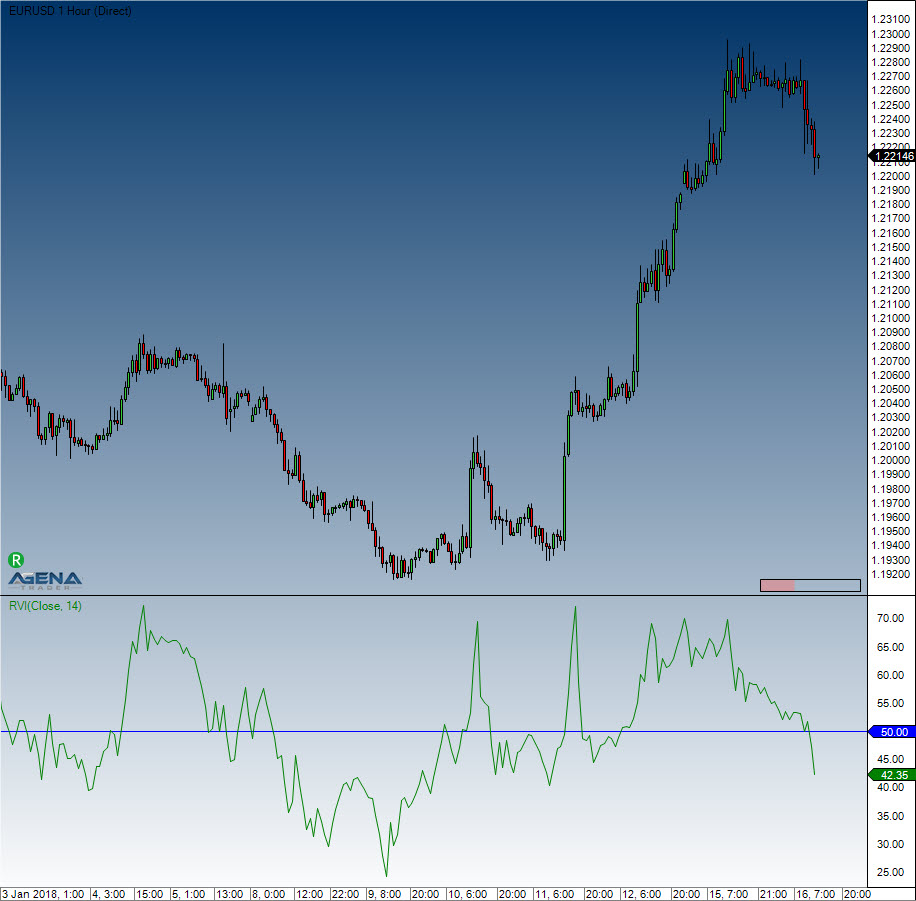
#### Example
```csharp
//Output of the RVI value
Print("The current value for the RVI is: " + RVI(14)[0]);
```
# R-Squared
#### Description
This indicator belongs to the linear regression series. R-Squared is the correlation coefficient that specifies the quality of the linear regression line.
It is the calculation that gives R-Squared its name – the value is the square of the correlation coefficient, which in mathematics is prefixed with the Greek letter Rho (P).
See [*Linear Regression*](https://agenatrader.github.io/AgenaIndicator-documentation/indicators_oscillators/#linearregression), [*LinRegSlope*](https://agenatrader.github.io/AgenaIndicator-documentation/indicators_oscillators/#linregslope), [*LinRegIntercept*](https://agenatrader.github.io/AgenaIndicator-documentation/indicators_oscillators/#linregintercept).
#### Interpretation
The value of the oscillator fluctuates between 0 and 1. By default, the upper boundary line is located at 0.75, and the lower border is at 0.2. If the prices are in a sideways movement, the data is scattered around the regression line. R-Squared will have a value of 0 in the aforementioned situation. In a strong trend phase, the prices will remain within a tight range for an extended period of time; if these are located close to the regression line then the R-Squared indicator will have a value of 1. Stanley Kroll and Tuchar Chande used the correlation coefficient as a trend filter in their book “*The new technical trader*”.
#### Further information
#### Usage
```csharp
RSquared(int period)
RSquared(IDataSeries inSeries, int period)
RSquared(int period)[int barsAgo]
RSquared(IDataSeries inSeries, int period)[int barsAgo]
```
#### Return value
**double**
When using this method with an index (e.g. **RSquared**(8)\[**int** barsAgo] ), the value of the indicator will be issued for the referenced bar.
#### Parameters
inSeries Input data series for the indicator
period Number of bars included in the calculations
#### Visualization
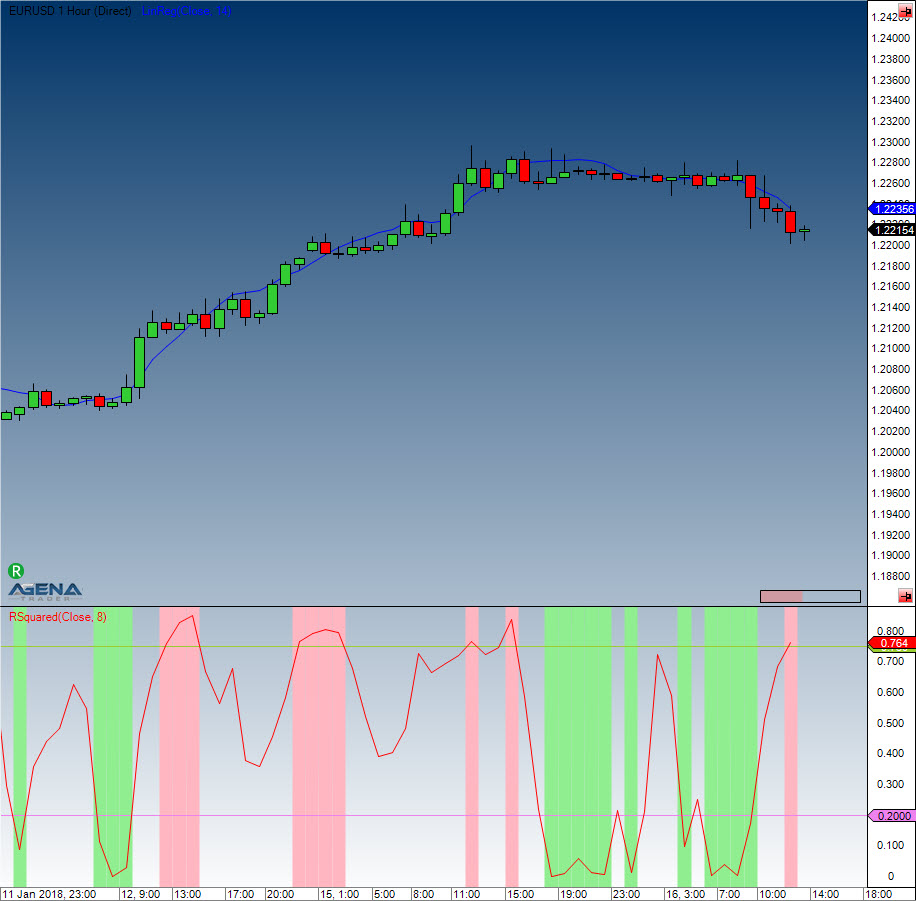
#### Example
```csharp
//Output for the value of R-Squared
Print("The current value of R-Squared is: " + RSquared(8)[0]);
```
# Standard Error (StdError)
#### Description
Jon Anderson came up with the Standard Error Bands, which are similar to the Bollinger Bands, but with a different calculation. An upper and a lower boundary around a middle line create the bands – this is also known as the linear regression. The lower standard error band results from the subtraction of two standard errors from the final value of the regression line. Because individual closing prices can have a huge influence on the values of the bands, it is necessary to use a Simple Moving Average to smooth the data.
#### Interpretation
One of the applications of the standard error bands is the tightening of the bands when prices rise/fall. If the bands tighten, it signifies that a trend is currently in place. A strong trend will continue to tighten the bands.
#### Further information
#### Usage
```csharp
StdError(int period)
StdError(IDataSeries inSeries, int period)
StdError(int period)[int barsAgo]
StdError(IDataSeries inSeries, int period)[int barsAgo]
//Upper band
StdError(int period).Upper[int barsAgo]
StdError(IDataSeries inSeries, int period).Upper[int barsAgo]
//Lower band
StdError(int period).Lower[int barsAgo]
StdError(IDataSeries inSeries, int period).Lower[int barsAgo]
```
#### Return value
**double**
When using this method with an index (e.g. **StdError**(21)\[**int** barsAgo] ), the value of the indicator will be issued for the referenced bar.
#### Parameters
inSeries Input data series for the indicator
period Number of bars included in the calculations
#### Visualization
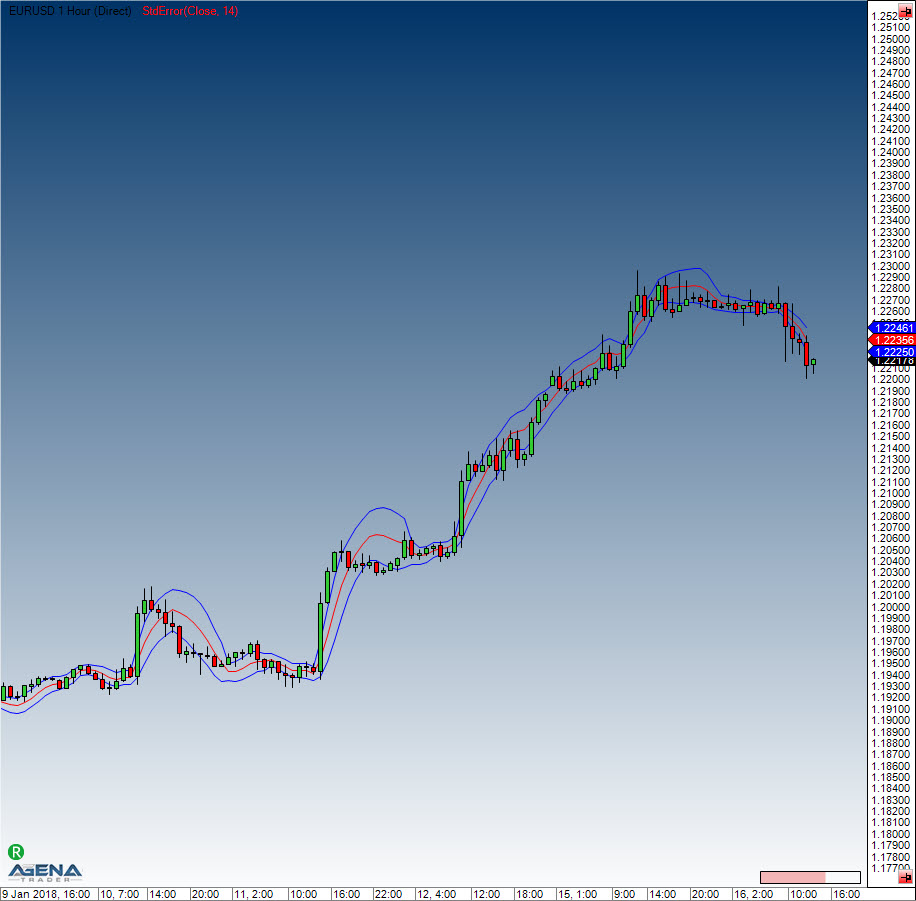
#### Example
```csharp
//Output for the values of the middle line
Print("The middle line is currently at: " + StdError(21)[0]);
//Output for the lower band
Print("The lower band of the standard error is currently at: " + StdError(21).Lower[0]);
//output for the upper band
Print("The upper band of the standard error is currently at: " + StdError(21).Upper[0]);
```
# Stochastics
#### Description
The stochastic indicator was developed by George C. Lane in the 1950s. It belongs to the class “momentum indicators” (oscillators) and represents the current closing price in relation to a high or low area over a defined number of periods. The stochastic indicator is based on the observation that in an uptrend, the closing price is close to the daily high, while in a downtrend, the closing price is closer to the daily low. The stochastic indicator consists of two exponential Average Lines (%K and %D), both of which range between 0 and 100. There are two types of stochastic: the classic slow stochastic and the fast stochastic.
**Fast stochastic:** The %D line is the smoothing average of the %K line
**Slow stochastic:** The %D is the basis on which the smoothing average is calculated. The slow stochastic smoothes the fast stochastic, thus stabilizing the oscillator.
#### Interpretation
The closing prices found in the upper area imply an accumulation (buying pressure); the lower area represents selling pressure. The stochastic indicator is a classic oscillator, and is primarily used in sideways markets in order to determine the reversal points. Days with a stable trend will not provide the indicator with any relevant or valuable results/information.
#### Further information
VTAD:
#### Usage
```csharp
Stochastics(int periodD, int periodK, int smooth)
Stochastics(IDataSeries inSeries, int periodD, int periodK, int smooth)
//For the %D line
Stochastics(int periodD, int periodK, int smooth).D[int barsAgo]
Stochastics(IDataSeries inSeries, int periodD, int periodK, int smooth).D[int barsAgo]
//For the %K line
Stochastics(int periodD, int periodK, int smooth).K[int barsAgo]
Stochastics(IDataSeries inSeries, int periodD, int periodK, int smooth).K[int barsAgo]
```
#### Return value
**double**
When using this method with an index (e.g. **Stochastics**(7,14,3)\[**int** barsAgo] ), the value of the indicator will be issued for the referenced bar.
#### Parameters
inSeries Input data series for the indicator
periodD Number of periods to be used for the %K smoothing
periodK Number of bars included in the %K calculation
smooth Number of periods for the smoothing of %D
#### Visualization
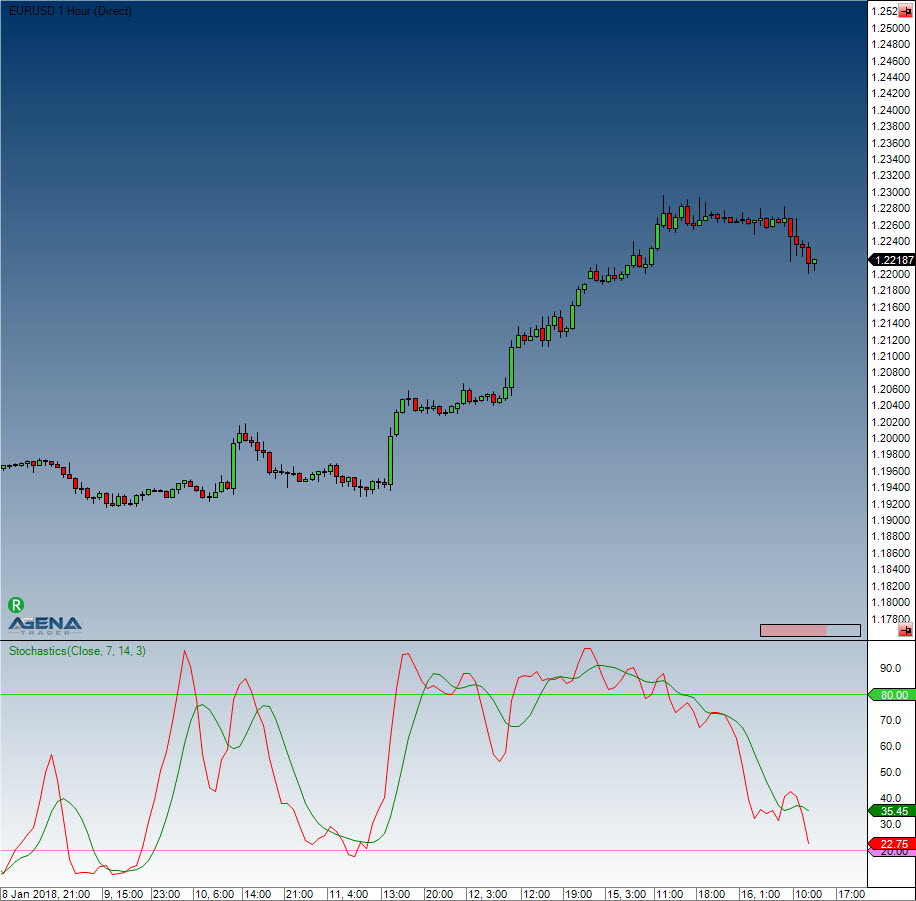
#### Example
```csharp
//Output for the %K line
Print("The stochastic line %K is currently at: " + Stochastics(3, 14, 7).K[0]);
//Output for the %D line
Print("The stochastic line %D is currently at: " + Stochastics(3, 14, 7).D[0]);
```
# Stochastics Fast
#### Description
See [*stochastics*](https://agenatrader.github.io/AgenaIndicator-documentation/indicators_oscillators/#stochastics).
#### Interpretation
Closing prices that are constantly in the upper area indicate accumulation (i.e. buying pressure), whilst the distribution (i.e. selling pressure) is shown by an indicator value in the lower area.
#### Further information
VTAD:
Charttec:
#### Usage
```csharp
StochasticsFast(int periodD, int periodK)
StochasticsFast(IDataSeries inSeries, int periodD, int periodK)
//For the %D line
StochasticsFast(int periodD, int periodK).D[int barsAgo]
StochasticsFast(IDataSeries inSeries, int periodD, int periodK).D[int barsAgo]
//For the %K line
StochasticsFast(int periodD, int periodK).K[int barsAgo]
StochasticsFast(IDataSeries inSeries, int periodD, int periodK).K[int barsAgo]
```
#### Return value
**double**
When using this method with an index (e.g. **StochasticsFast**(7,14)\[**int** barsAgo] ), the value of the indicator will be issued for the referenced bar.
#### Parameters
inSeries Input data series for the indicator
periodD Number of periods for the smoothing of %K
periodK Number of periods included in the calculation of %K
#### Visualization
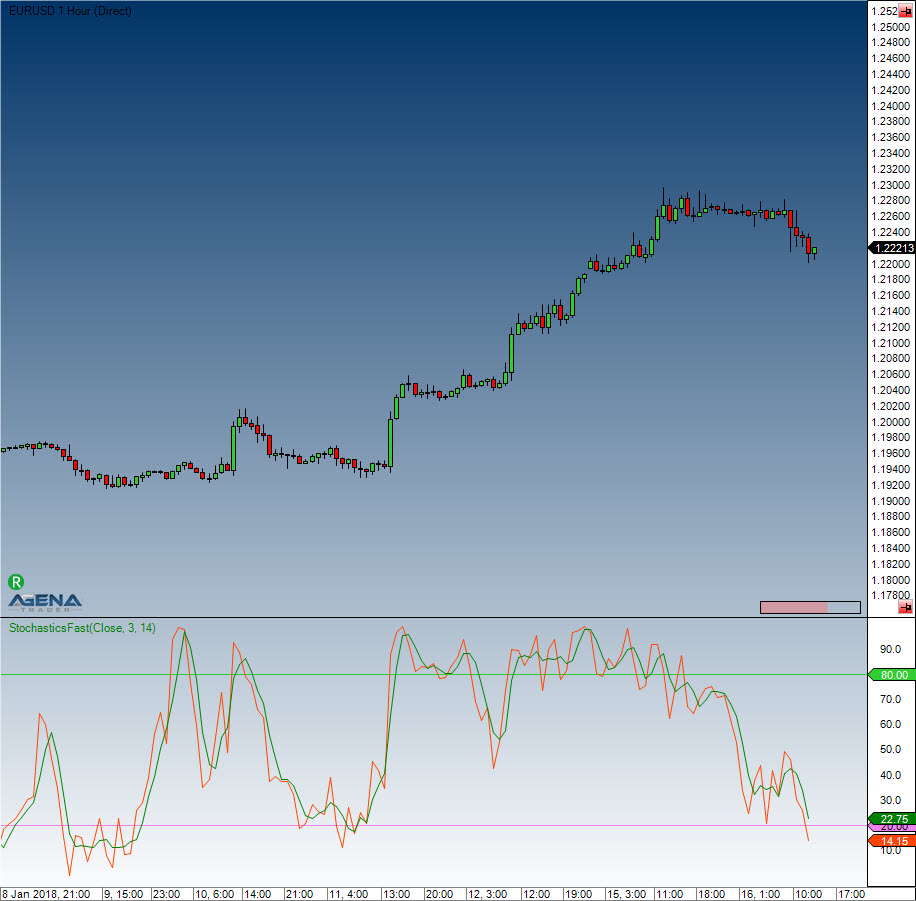
#### Example
```csharp
//Output for the %K line of the fast stochastic
Print("The stochastic line %K is currently at: " + StochasticsFast(3, 14).K[0]);
//Output %D line
Print("The stochastic line %D is currently at: " + StochasticsFast(3, 14).D[0]);
```
# Stochastics RSI (StochRSI)
#### Description
Stochastics RSI is a calculation of the stochastic based on the RSI indicator.
#### Interpretation
The indicator provides fast and precise extreme values/points in the price movements. The StochRSI can be used as a trend filter in higher timeframes as well as a tool for better entry timing.
#### Further information
#### Usage
```csharp
StochRSI(int period)
StochRSI(IDataSeries inSeries, int period)
StochRSI(int period)[int barsAgo]
StochRSI(IDataSeries inSeries, int period)[int barsAgo]
```
#### Return value
**double**
When using this method with an index (e.g. **StochRSI**(14)\[**int** barsAgo] ), the value of the indicator will be issued for the referenced bar.
#### Parameters
inSeries Input data series for the indicator
period Number of bars included in the calculations
#### Visualization
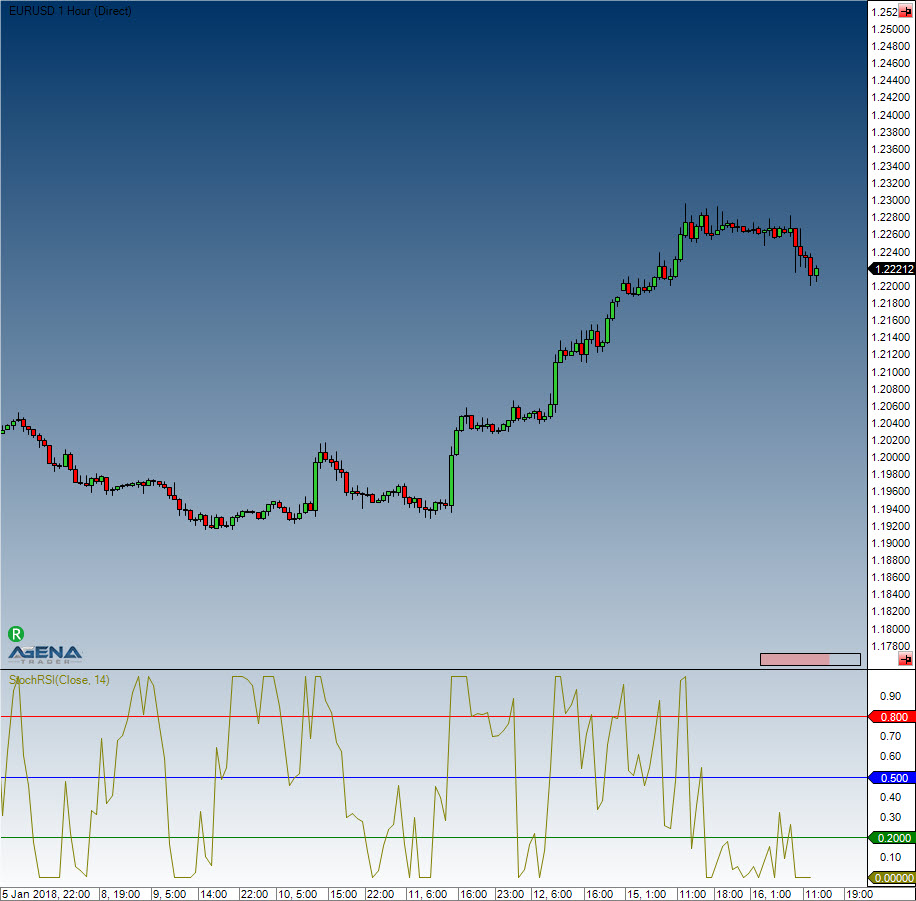
#### Example
```csharp
//Output for the StochRSI
Print("The current value for the StochRSI is: " + StochRSI(14)[0]);
```
# Summation (SUM)
#### Description
Summation is the sum over a predefined number of periods.
#### Usage
```csharp
SUM(int period)
SUM(IDataSeries inSeries, int period)
SUM(int period)[int barsAgo]
SUM(IDataSeries inSeries, int period)[int barsAgo]
```
#### Return value
**double**
When using this method with an index (e.g. **SUM**(14)\[**int** barsAgo] ), the value of the indicator will be issued for the referenced bar.
#### Parameters
inSeries Input data series for the indicator
period Number of bars included in the calculations
#### Visualization
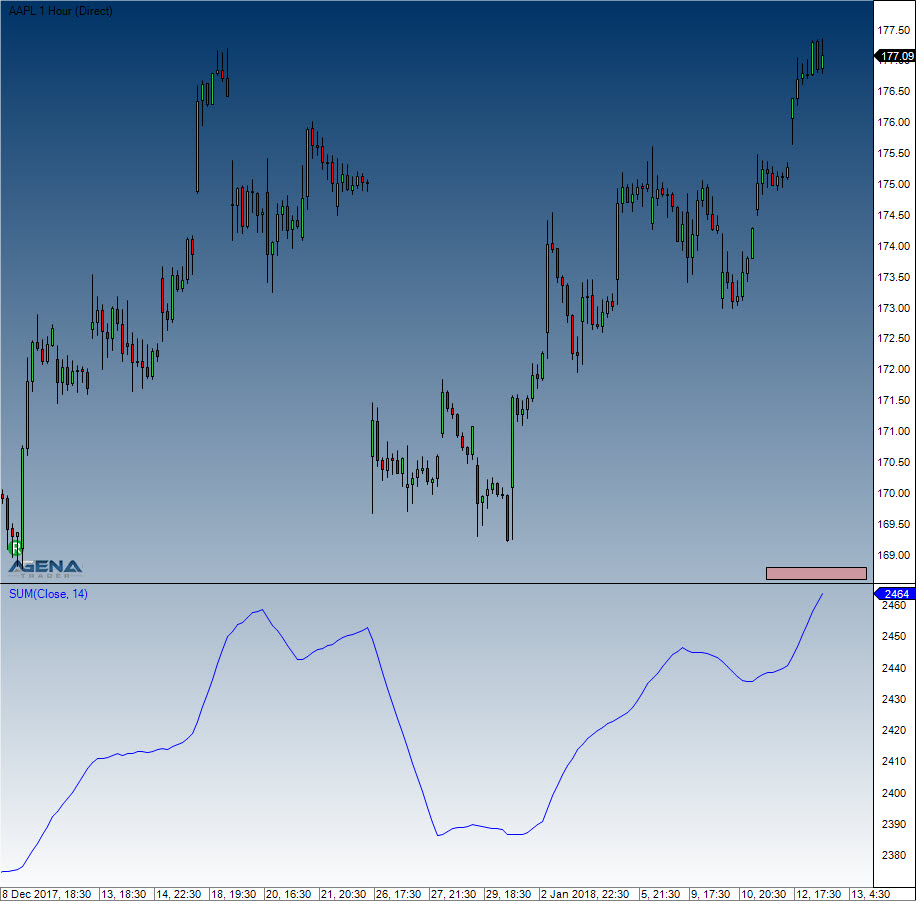
#### Example
```csharp
// Sum of the volume for the last 10 trading days
Print(SUM(Volume,10)[0]);
```
# SuperTrend
#### Description
The SuperTrend indicator was invented by a French trader. SuperTrend is similar to the Parabolic Stop and Reverse System (Parabolic SAR), and is based on the median values of the candles. It measures volatility as a span between high and low, not taking potential price gaps into account. The indicator, which originates from a starting value, continues to proceed in one direction until the market changes direction, combined with rising volatility. This causes the indicator to adjust its starting value to match that of the counter-direction. The indicator is programmed in such a way that nothing but the trend direction can bring about a change. Dropping volatility combined with movements against the trend direction cause the indicator to move horizontally.
#### Interpretation
There are multiple interpretations and applications for the SuperTrend. Forex traders prefer to trade the crosses directly. This way, the system will continuously be inside the market and only needs to be complemented by a stop and further trading logic settings. Analytically speaking, the SuperTrend indicator is only able to provide information about the current trend. If the market is above the indicator, then an uptrend exists, otherwise a downtrend is in force. The indicator can be used as an exit for additional trading systems, meaning that an open position can be closed if a trend change occurs.
#### Usage
```csharp
SuperTrend(SuperTrendMode stMode, int length, double multiplier, SuperTrendMAType maType, int smooth)
SuperTrend(IDataSeries inSeries, SuperTrendMode stMode, int length, double multiplier, SuperTrendMAType maType, int smooth)
SuperTrend(SuperTrendMode stMode, int length, double multiplier, SuperTrendMAType maType, int smooth)[int barsAgo]
SuperTrend(IDataSeries inSeries, SuperTrendMode stMode, int length, double multiplier, SuperTrendMAType maType, int smooth)[int barsAgo]
//For the values of the uptrend:
SuperTrend(SuperTrendMode stMode, int length, double multiplier, SuperTrendMAType maType, int smooth).UpTrend[int barsAgo]
SuperTrend(IDataSeries inSeries, SuperTrendMode stMode, int length, double multiplier, SuperTrendMAType maType, int smooth).UpTrend[int barsAgo]
//For the values of the downtrend:
SuperTrend(SuperTrendMode stMode, int length, double multiplier, SuperTrendMAType maType, int smooth).DownTrend[int barsAgo]
SuperTrend(IDataSeries inSeries, SuperTrendMode stMode, int length, double multiplier, SuperTrendMAType maType, int smooth).DownTrend[int barsAgo]
```
#### Return value
**double**
When using this method with an index (e.g. **SuperTrend**(...).UpTrend\[**int** barsAgo] ), the value of the indicator will be issued for the referenced bar.
#### Parameters
| | |
| --------------------- | ----------------------------------------------------------------- |
| InSeries | Input data series for the indicator |
| maType | For the calculation of the MA, the following methods can be used: |
| SuperTrendMAType.HMA | |
| SuperTrendMAType.SMA | |
| SuperTrendMAType.SMMA | |
| SuperTrendMAType.TEMA | |
| SuperTrendMAType.TMA | |
| SuperTrendMAType.VMA | |
| SuperTrendMAType.VWMA | |
| SuperTrendMAType.WMA | |
Also see: [*HMA*](https://agenatrader.github.io/AgenaIndicator-documentation/indicators_oscillators/#hma-hull-moving-average), [*SMA*](https://agenatrader.github.io/AgenaIndicator-documentation/indicators_oscillators/#sma-simple-moving-average), [*SMMA*](https://agenatrader.github.io/AgenaIndicator-documentation/indicators_oscillators/#smma-smoothed-moving-average), [*TEMA*](https://agenatrader.github.io/AgenaIndicator-documentation/indicators_oscillators/#tema-triple-exponential-moving-average), [*TMA*](https://agenatrader.github.io/AgenaIndicator-documentation/indicators_oscillators/#tma-triangular-moving-average), [*VMA*](https://agenatrader.github.io/AgenaIndicator-documentation/indicators_oscillators/#vma-variable-moving-average), [*VWMA*](https://agenatrader.github.io/AgenaIndicator-documentation/indicators_oscillators/#vwma-volume-weighted-moving-average), [*WMA*](https://agenatrader.github.io/AgenaIndicator-documentation/indicators_oscillators/#wma-weighted-moving-average). Default: HMA | | multiplier | This is a multiplier for the internal calculation of the offset. This is only used when the method is set to ATR and DualThrust. (In the adaptive mode, the multiplier uses the Homodyne Discriminator) Default: 2.618 | | Period | Number of bars used for the calculation of the moving average Default: 14 | | smooth | Values for additional smoothing If no smoothing is necessary, this value can be set to 1 Default: 14 | | stMode | The following methods can be chosen: SuperTrendMode.ATR, SuperTrendMode.DualThrust, SuperTrendMode.Adaptive The Period Parameter will have a huge influence when the DualThrustMode is selected. The smaller the period, the tighter the indicator will follow price developments. Default: SuperTrendMode.ATR |
#### Visualization
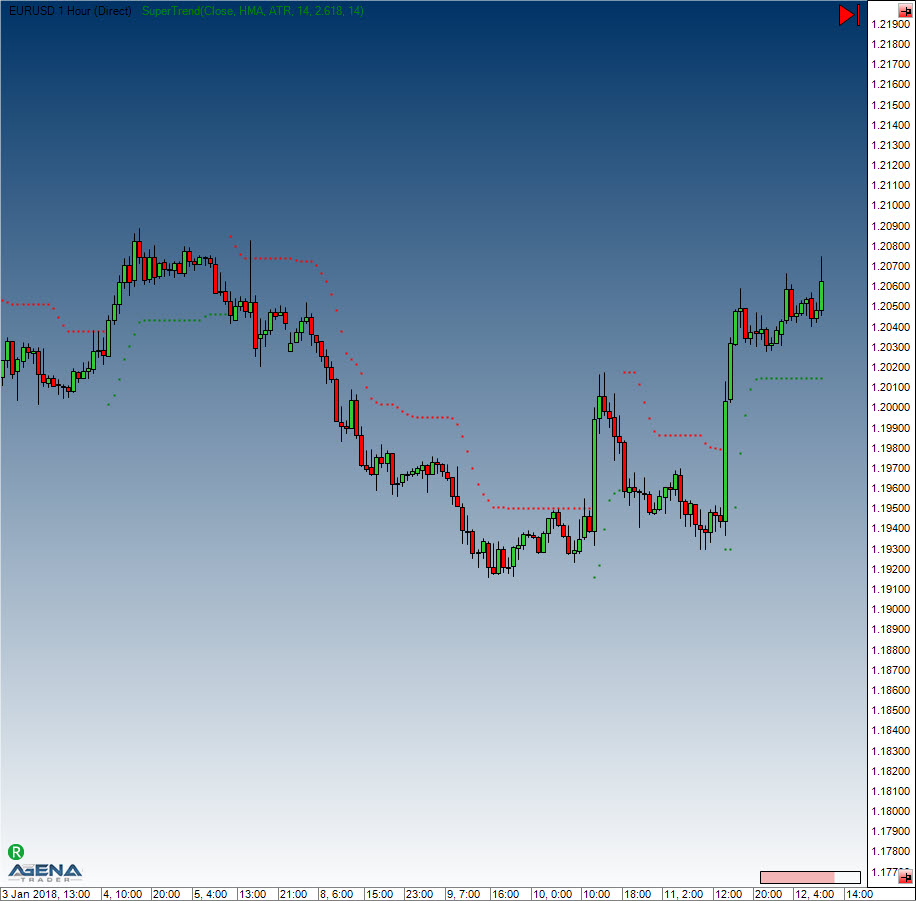
#### Example
```csharp
if (Close[0] > SuperTrend(SuperTrendMAType.HMA, SuperTrendMode.ATR, 14, 2.618, 14).UpTrend[0])
Print("The market is in an uptrend.");
if (Close[0] < SuperTrend(SuperTrendMAType.HMA, SuperTrendMode.ATR, 14, 2.618, 14).DownTrend[0])
Print("The market is in a downtrend.");
```
# SupportResistanceAreas
#### Description
This indicator draws support and resistance areas in the chart. There are 4 different types of possible supports and resistances, which are differentiated by various colors.
Support due to a lower high (ColorLowerHigh)
Support due to a lower low (ColorLowerLow)
Resistance due to a higher high (ColorHigherHigh)
Resistance due to a higher low (ColorHigherLow)
#### Interpretation
S/R zones play an important role in technical analysis. Clearly defined and identifiable support areas provide favorable entry opportunities, while resistance areas provide target zones to exit those trades. Once broken, these areas tend to reverse their function, meaning that a broken support zone becomes a resistance zone.
#### Parameters
| | |
| ------------------------------------------------------ | ------------------------------------------------------------------------------------------------ |
| ATRRangeFactor | Settings for the width of the support/resistance area as calculated by the ATR. |
| The smallest configurable value is 0.1; default is 0.3 | |
| Levels | This setting defines how many S/R zones of the same type are displayed. The default is 3 |
| Opacity | Transparency of the bars to be drawn into the chart; 0 (transparent) – 255 (completely visible). |
| Default is 70 | |
| SensibilityFactor | Defines the sensitivity of the S/R search. |
| The smallest setting is 1; the default is 5 | |
#### Visualization
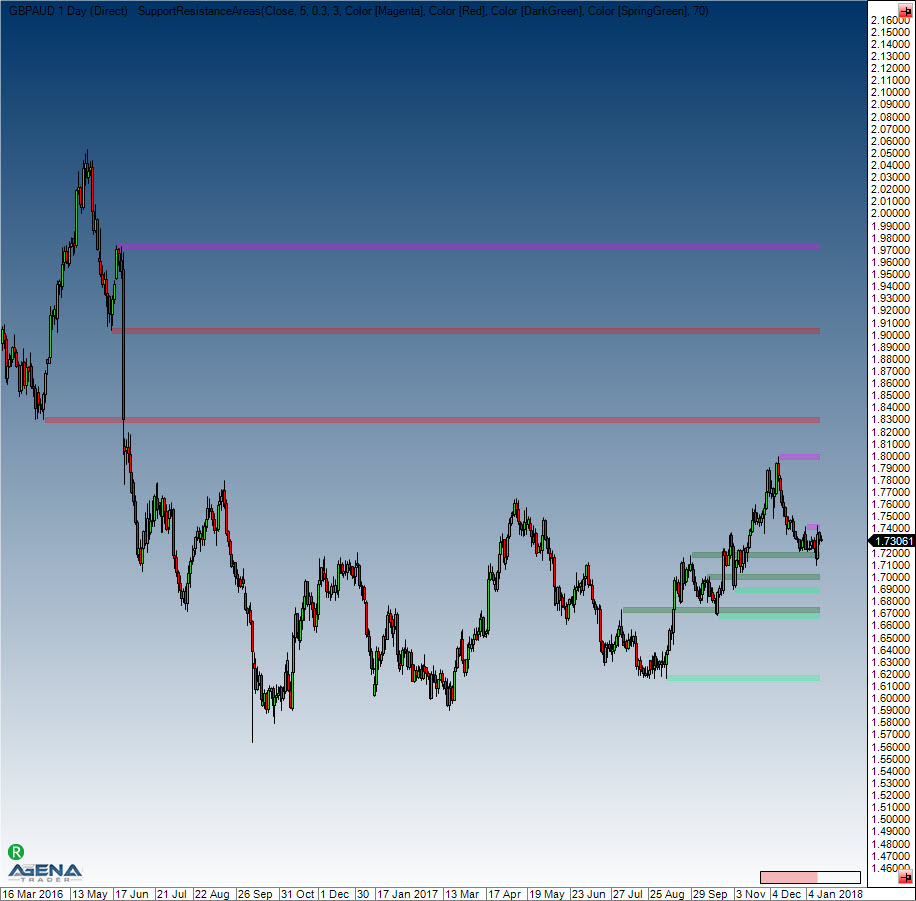
# Swing
#### Description
Based on the strength of the swing highs or the swing lows, the swing indicator draws a line at these points. The number of bars to the left and right of the extreme point is the determining factor for the strength. Methods for these indicators can also be implemented for other scripts.
#### Interpretation
The methods for these indicators can be used in scripts to determine the last extreme point and its corresponding price value. The highs and lows of these points may then be used as entry, stop or target markers.
#### Usage
```csharp
//For a high
Swing(int strength).SwingHighBar(int barsAgo, int instance, int lookBackPeriod);
Swing(IDataSeries inSeries, int strength).SwingHighBar(int barsAgo, int instance, int lookBackPeriod);
//For a low
Swing(int strength).SwingLowBar(int barsAgo, int instance, int lookBackPeriod);
Swing(IDataSeries inSeries, int strength).SwingLowBar(int barsAgo, int instance, int lookBackPeriod);
```
#### Return value
**double**
When using this method with an index (e.g. **Swing**(5)\[**int** barsAgo] ), the value of the indicator will be issued for the referenced bar.
**When the current bar is smaller than the parameter strength, or if no swing high/low has been found, the return value is -1.**
#### Parameters
| | |
| -------------- | ------------------------------------------------------------------------------------------------------------ |
| barsAgo | Starting point for the search |
| InSeries | Input data series for the indicator |
| instance | The number of occurrences of extreme points (1 is the last occurrence, 2 is the second last occurrence etc.) |
| length | Number of bars included in the calculation |
| lookBackPeriod | Number of bars in the past in which swing points will be searched for (search area) |
| strength | Number of bars to the left and right of the extreme points |
#### Visualization
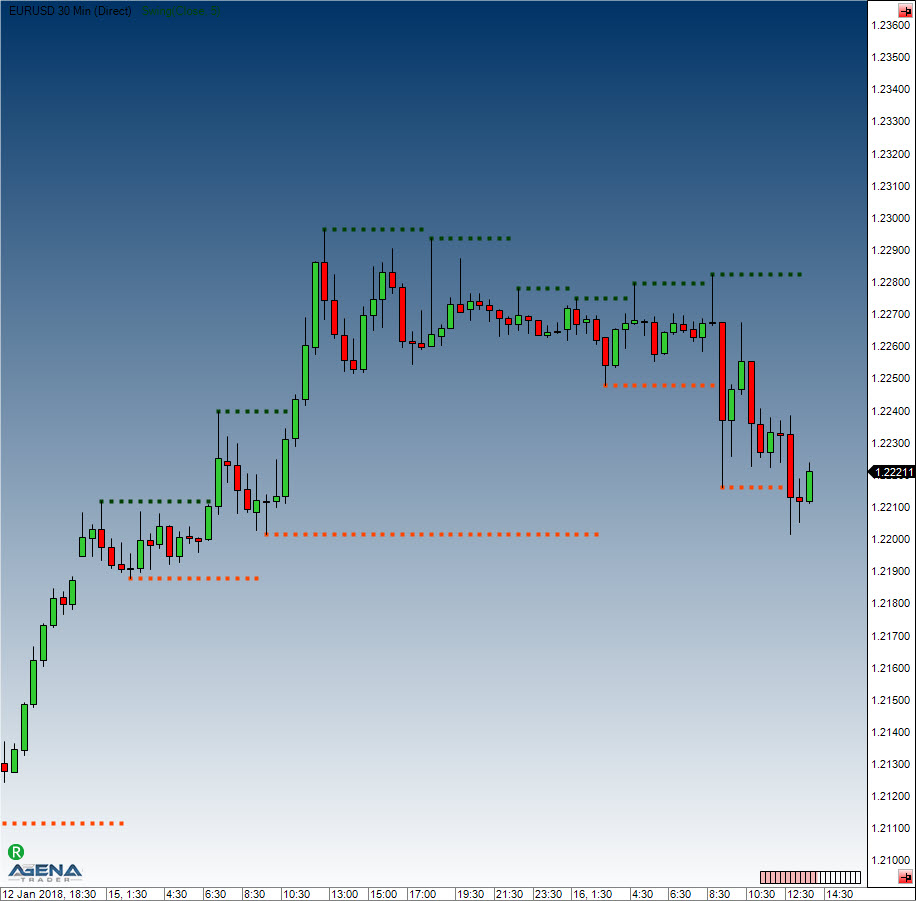
#### Example
```csharp
// Position and price of the last swing high
int barsAgo = Swing(5).SwingHighBar(0, 1, 10);
Print("The last swing high was " + barsAgo + " bars ago.");
Print("The last swing high was at " + High[barsAgo]);
```
# Time-Series-Forecast (TSF)
#### Description
The Time-Series-Forecast is quite similar to a moving average. Here, the trend is established based on a regression equation that uses the smallest square formula. The goal of the TSF is to anticipate future price movements with the help of currently existing data.
#### Interpretation
The TSF reacts faster than the moving averages. These always have time delays when depicting the pre-existing trends. The TSF formula never allows the distance to the current price to become too large, thus permitting sharper trade reversal recognition.
An entry is placed when the price breaks the TSF line from bottom to top.
#### Further information
#### Usage
```csharp
TSF(int forecast, int period)
TSF(IDataSeries inSeries, int forecast, int period)
TSF(int forecast, int period)[int barsAgo]
TSF(IDataSeries inSeries, int forecast, int period)[int barsAgo]
```
#### Return value
**double**
When using this method with an index (e.g. **TSF**(3,14)\[**int** barsAgo] ), the value of the indicator will be issued for the referenced bar.
#### Parameters
forecast Number of bars used for the forecast
inSeries Input data series for the indicator
period Number of bars included in the calculations
#### Visualization
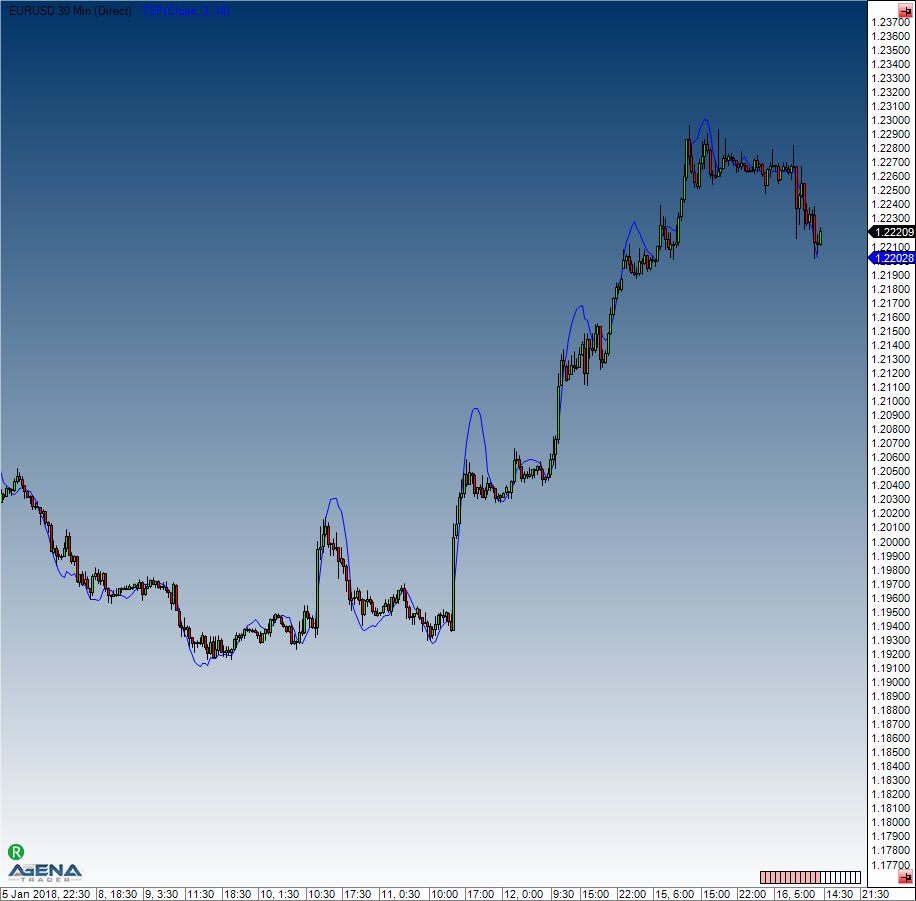
#### Example
```csharp
//Output the TSF values
Print("The current value for the TSF is: " + TSF(3, 14)[0]);
```
# Constant Lines
#### Description
The Constant Lines tool can draw a maximum of four freely configurable horizontal lines within a chart. In general, it is used to label certain price levels in order to keep an eye on them.
#### Usage
```csharp
ConstantLines(double line1Value, double line2Value, double line3Value, double line4Value)
ConstantLines(double line1Value, double line2Value, double line3Value, double line4Value)[barsAgo]
ConstantLines(double line1Value, double line2Value, double line3Value, double line4Value).Line1[barsAgo]
ConstantLines(double line1Value, double line2Value, double line3Value, double line4Value).Line2[barsAgo]
ConstantLines(double line1Value, double line2Value, double line3Value, double line4Value).Line3[barsAgo]
ConstantLines(double line1Value, double line2Value, double line3Value, double line4Value).Line4[barsAgo]
```
#### Return value
**double**
When using this method with an index (e.g. **ConstantLines**(1,2,3,4)\[**int** barsAgo] ), the value of the indicator will be issued for the referenced bar.
#### Visualization
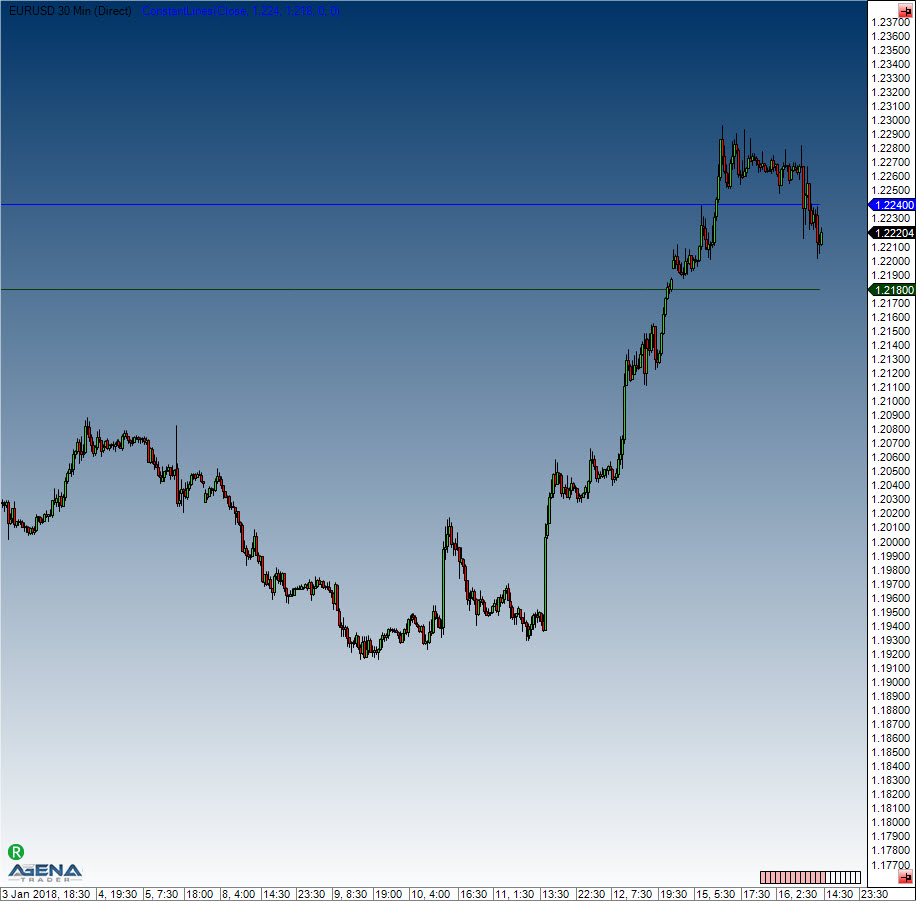
# CurrentDayOHL
#### Description
This function delivers the values for the open, high and low of the current day i.e. session.
CurrentDayOHL is intended for use with intraday data series.
See [*PriorDayOHLC*](https://agenatrader.github.io/AgenaIndicator-documentation/indicators_oscillators/#priordayohlc), [*DayLines*](https://agenatrader.github.io/AgenaIndicator-documentation/indicators_oscillators/#daylines).
#### Parameter
inSeries Input data series for the indicator
#### Return value
**double**
When using this method with an index (e.g. **CurrentDayOHL**.CurrentOpen\[**int** barsAgo] ), the value of the indicator will be issued for the referenced bar.
#### Usage
```csharp
CurrentDayOHL()
CurrentDayOHL(IDataSeries inSeries)
int barsAgo = 0;
//For the open value
CurrentDayOHL().CurrentOpen[ barsAgo]
CurrentDayOHL(IDataSeries inSeries).CurrentOpen[ barsAgo]
//For the high value
CurrentDayOHL().CurrentHigh[ barsAgo]
CurrentDayOHL(IDataSeries inSeries).CurrentBarHigh[ barsAgo]
//For the low value
CurrentDayOHL().CurrentLow[ barsAgo]
CurrentDayOHL(IDataSeries inSeries).CurrentLow[ barsAgo]
```
#### Visualization
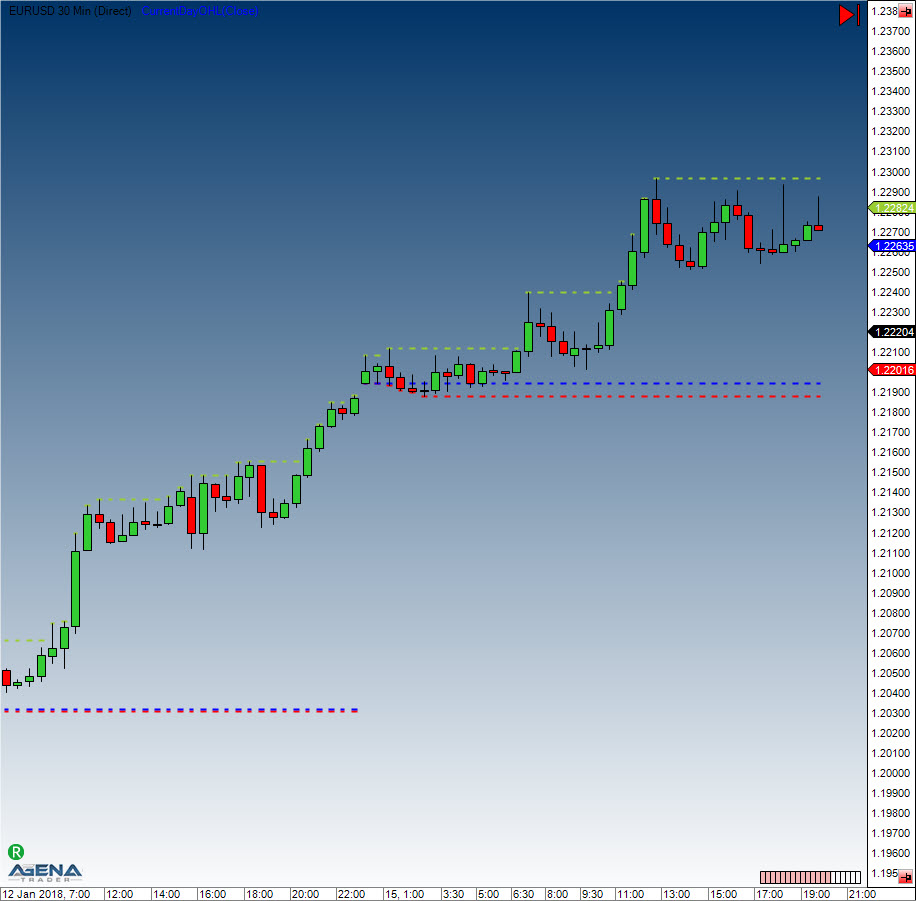
#### Example
```csharp
Print("The low of the current session is at " + CurrentDayOHL().GetCurrentBar().Low[0]);
```
---
[Next Page](/llms-full.txt/1)