> For the complete documentation index, see [llms.txt](https://indicators.agenatrader.com/llms.txt). Markdown versions of documentation pages are available by appending `.md` to page URLs; this page is available as [Markdown](https://indicators.agenatrader.com/premium-indicators/volume-addon/volumerisefall.md).
# VolumeRiseFall
**The installation of the Technical Analysis Package is required in order to access this indicator.**
#### Description
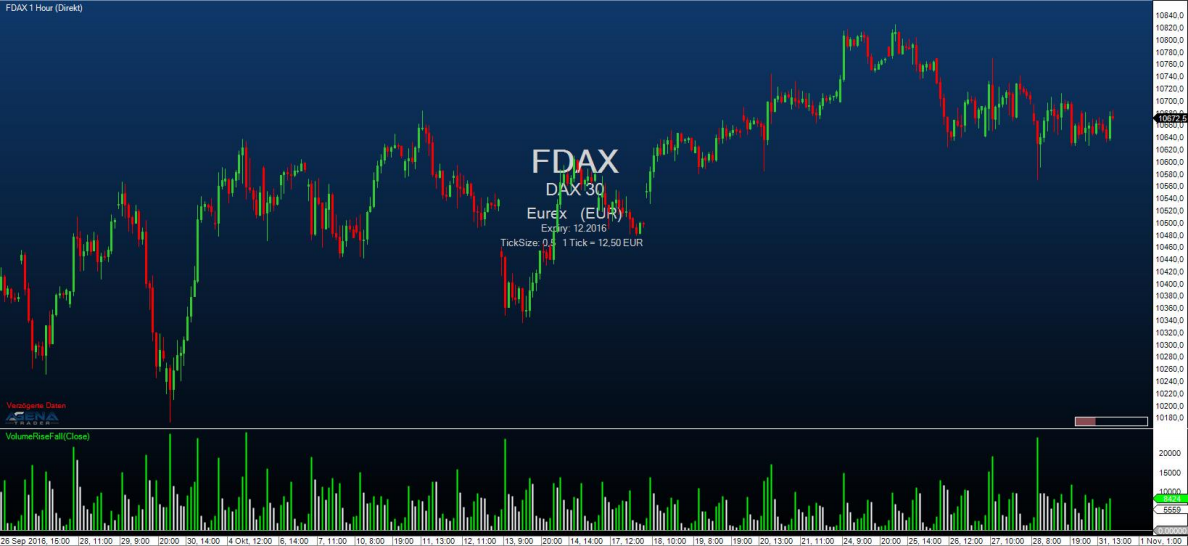
The VolumeRiseFall indicator is a normal volume display as volume bars, with, however, a different coloring than normal. A volume bar is drawn in green when the volume of this bar is higher than the volume of the previous bar, meaning that rising volume is present. A volume bar is drawn in gray when the volume of this bar is lower than the volume of the previous bar, thereby showing falling volume.
#### Parameters
to be announced
#### Return value
to be announced
#### Usage
to be announced
#### Visualization
#### Example
to be announced