> For the complete documentation index, see [llms.txt](https://indicators.agenatrader.com/llms.txt). Markdown versions of documentation pages are available by appending `.md` to page URLs; this page is available as [Markdown](https://indicators.agenatrader.com/premium-indicators/dowtheory-addon/p123pro.md).
# P123Pro
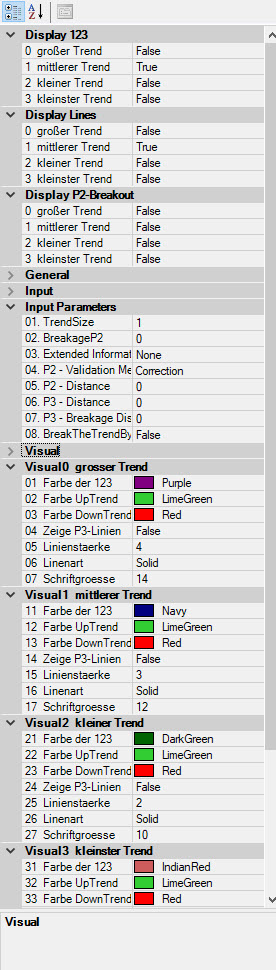
The parameter TrendSize can be found under the parameter settings (see figure). It is only intended to be used within the Condition Escort. This parameter is not relevant for display in the chart. The display is only controlled by the following settings: "Display 123" and "Display Lines".
You can see in the respectful description fields for each parameter to which extend the particular parameters may influence the chart or Condition Escort as well as AgenaScript.
#### Usage in the AgenaScript
For the AgenaScript purposes several data series of the same type are doubled. For each of these data series the common notation with ...\[barsAgo] can be used.
| | |
| ----------------- | ----------------------------------------------------------------------------------------------------------------------------------------------------------------------------------------------------------------------------------------------------------------- |
| TrendDirection | 1 = Uptrend -1 = Downtrend 0 = no trend defined according to the market technique |
| IsP21 | If a bar represents an old point 2 and at the same time a new point 1, it will be labelled in the chart as "(2) 1". The value of this bar (and all subsequent bars up to the next point 2) will be 1, and 0 otherwise. |
| IsTrendValid | 1 = defines a confirmed trend, i.e. at least a point sequence 1 - 2 - 3 - 2. 0 = there is no confirmed trend yet. (Phase 1 and 2 according to market technique) |
| LastPoint | Provides the latest point of the trend, i.e. 1, 2, or 3 |
| LastPointPrice | Provides the corresponding market value of the latest point according to the market technique |
| LastPointDateTime | Provides the corresponding date and time related to the latest point according to the market technique |
| LastPointExtInfo | Provides the corresponding label of the latest point according to the market technique. The labelling should be additionally defined in Parameter tab. The slope is a chart-only feature therefore it is neither in Conditions, nor in the AgenaScript available. |
| P1Price | Provides the market value of the latest point 1 |
| P1DateTime | Provides the date and time of the latest point 2 |
| PriorP2Price | efert die Datums- und Zeitangabe des vorletzten Punkt 2 |
| TempP3Price | Provides the date and time of the second last point 2 |
| TempP3DateTime | Provides the date and time of the last preliminary point 3 |
| ValidP3Price | Provides the market value of the last valid point 3. This market value defines the stop movement according to the market techniques. When this point is crossed, there is a trend break from the market technique perspective. |
| ValidP3DateTime | Provides the date and time of the last valid point 3 |
#### Parameters
| | |
| ------------------ | ------------------------------------------------------------------------------------------------------------------------------------------------------------------------------------------------------------------------------------------------------------------ |
| trendsize | Trend size of 0 .. 3 |
| breakageP2 | Shows an arrow in the chart, when a break of P2 occurs or has been already completed. The figure is expressed as a percentage between -100 and +100. -20 alerts e.g. 20% before the P2 will be reached |
| extInfo | Selection of a labelling |
| p2Distance | **Uncertainty:** this is a factor (between 0 and 1) that defines, how far has to be the P2 from the "old" valid P2 in order to be treated as valid. The previous movement is decisive in this case. |
| p3Distance | **Uncertainty:** this is a factor (between 0 and 1) that defines, how far has to be the P3 from the "old" valid P2 in order to be treated as valid. The previous movement is decisive in this case.. |
| p3BreakageDistance | **Uncertainty:** this is a factor (between 0 and 1) that defines when a trend brake is valid. The previous movement is decisive in this case. So, for instance, the breakout of the latest P3 (with one tick only) will not be considered as the breakout anymore. |
#### Examples
```csharp
private void PrintOutTrendProperties(int trendSize)
private void PrintOutTrendProperties(int trendSize)
{
// revers order of prints fills output window in correct order
Print("");
Print("IsP21: " + P123Pro(trendSize).IsP21[0]);
Print("valid P3 date: " + P123Pro(trendSize).ValidP3DateTime[0]);
Print("valid P3 price: " + P123Pro(trendSize).ValidP3Price[0]);
Print("temp P3 date: " + P123Pro(trendSize).TempP3DateTime[0]);
Print("temp P3 price: " + P123Pro(trendSize).TempP3Price[0]);
Print("P2 date: " + P123Pro(trendSize).P2DateTime[0]);
Print("P2 price: " + P123Pro(trendSize).P2Price[0]);
Print("P1 date: " + P123Pro(trendSize).P1DateTime[0]);
Print("P1 price: " + P123Pro(trendSize).P1Price[0]);
Print("last point date: " + P123Pro(trendSize).LastPointDateTime[0]);
Print("last point price: " + P123Pro(trendSize).LastPointPrice[0]);
Print("last point: " + P123Pro(trendSize).LastPoint[0]);
Print("Is trend valid: " + P123Pro(trendSize).IsTrendValid[0]);
Print("Trend direction: " + P123Pro(trendSize).TrendDirection[0]);
Print("P2Breakout: " + P123Pro(trendSize).P2Breakout[0]);
Print("Extended Information: " + P123Pro(trendSize).LastPointExtInfo[0]);
}
```
#### Usage in the Condition Escort
All data series (excluding the DateTime series) are available in the Condition Escort under the "Series & Output Values".
Logical variables (true and false) are replaced by the numbers 1 and 0. The "TrendSize" parameter is available in the Condition Escort as well. The description you will find below.
#### Examples
Inquiry whether the currently active in the chart middle trend is a downtrend: P123Pro(Close, 1).TrendDirection\[0] - Inh. TimeFrame == 1
Inquiry whether the latest point of the currently active in the chart smallest trend is a Point2: P123Pro(Close, 3).LastPoint\[0] - Inh. TimeFrame == 2
Inquiry whether the latest bar under the valid point 3 (not the 3?) of the small trend has been closed: P123Pro(Close, 2).isTrendValid\[0] - Inh. TimeFrame == 1 UND (also neue Zeile) Close\[0] - Inh. TimeFrame < P123Pro(Close, 2).ValidP3Price\[0] - Inh. TimeFrame