> For the complete documentation index, see [llms.txt](https://indicators.agenatrader.com/llms.txt). Markdown versions of documentation pages are available by appending `.md` to page URLs; this page is available as [Markdown](https://indicators.agenatrader.com/standard-indicators/bollinger-band-width-bbwidth.md).
# Bollinger Band Width (BBWidth)
#### Description
This indicator is derived from Bollinger Bands. John Bollinger refers to Bollinger Band Width as one of two indicators that one can derive from Bollinger Bands; the other indicator is %B. The Band Width measures the percentage difference between the upper and the lower band. It decreases as Bollinger Bands narrow, and increases as they widen. Since Bollinger Bands are based on the standard deviation, falling Band Width reflects decreasing volatility and rising Band Width reflects the opposite.
#### Interpretation
John Bollinger uses the Band Width to recognize rising and falling trends. Most trends have their origins within sideway market movements that generally have a low volatility. If a breakout is accompanied by a sudden rise in the Band Width, this means that there is definite support for the move.
#### Further information
VTAD: [*http://vtadwiki.vtad.de/index.php/Bollinger\_B%C3%A4nder*](http://vtadwiki.vtad.de/index.php/Bollinger_B%C3%A4nder)
Book "Technische Indikatoren - simplified" by Oliver Paesler (German only)
#### Usage
```csharp
BBWidth(double numStdDev, int period)
BBWidth(IDataSeries inSeries, double numStdDev, int period)
BBWidth(double numStdDev, int period)[int barsAgo]
BBWidth(IDataSeries inSeries, double numStdDev, int period)[int barsAgo]
//For the value of the upper Band Width
BBWidth(double numStdDev, int period).BandWidth
BBWidth(IDataSeries inSeries, double numStdDev, int period).BandWidth
BBWidth(double numStdDev, int period).BandWidth[int barsAgo]
BBWidth(IDataSeries inSeries, double numStdDev, int period).BandWidth[int barsAgo]
//For the value of the trigger line (threshold)
BBWidth(double numStdDev, int period).Threshold
BBWidth(IDataSeries inSeries, double numStdDev, int period).Threshold
BBWidth(double numStdDev, int period).Threshold[int barsAgo]
BBWidth(IDataSeries inSeries, double numStdDev, int period).Threshold[int barsAgo]
```
#### Return value
**double**
When using the method with an index (e.g. **BBWidth**(2, 20)\[**int** barsAgo] ), the value of the indicator will be outputted for the referenced bar.
#### Parameters
inSeries Input data series for the indicator
period Number of bars included in the calculation
numStdDev Standard deviation
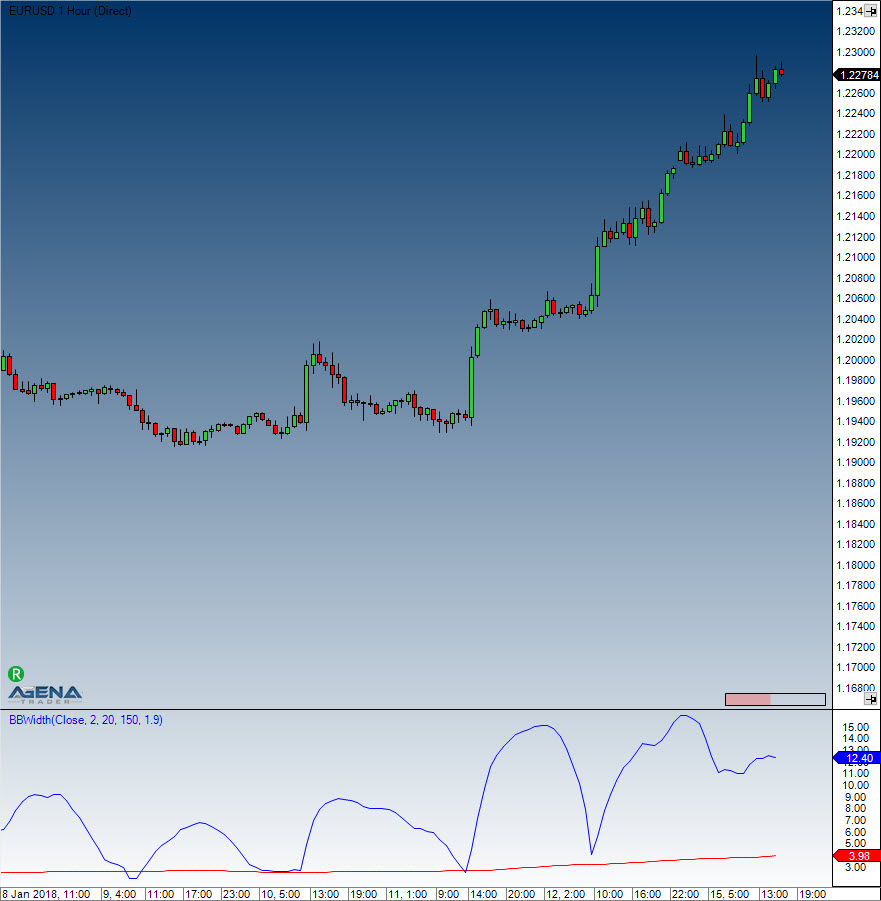
#### Visualization
#### Example
```csharp
//Output for the values of Bollinger Band Width
Print("The value of the Bollinger Band Width is: " + BBWidth(2, 20).BandWidth[0]);
//Output for the values for the signal line
Print("The value of the signal line is: " + BBWidth(2, 20).Threshold[0]);
```