> For the complete documentation index, see [llms.txt](https://indicators.agenatrader.com/llms.txt). Markdown versions of documentation pages are available by appending `.md` to page URLs; this page is available as [Markdown](https://indicators.agenatrader.com/standard-indicators/bollinger-bands.md).
# Bollinger Bands
#### Description & Interpretation
Bollinger Bands®, which were developed by John Bollinger, are volatility bands that are placed above and below a moving average. The volatility is based on the standard deviation, which fluctuates as volatility increases and decreases. An increase in volatility causes the bands to automatically widen, and a decrease in volatility causes them to automatically narrow. The Bollinger Bands’ dynamic nature means that they can also be used on different securities with the standard settings. When it comes to signals, Bollinger Bands can be used to identify M-Tops and W-Bottoms, or for determining a trend’s strength.
**Bollinger Bands are made up of a middle band with two outer bands.** The middle band is a simple moving average that is normally set to 20 periods. The reason a simple moving average is used is that the standard deviation formula also uses a simple moving average. The look-back period for the standard deviation is the same as for the simple moving average. The outer bands are generally set 2 standard deviations above and below the middle band, but settings can be adjusted to suit the characteristics of specific securities or trading styles. Bollinger recommends making small, incremental adjustments to the standard deviation multiplier. Changing the number of periods for the moving average also has an effect on the number of periods used to calculate the standard deviation, which is why only small adjustments are required for the standard deviation multiplier. An increase in the moving average period would also automatically increase the number of periods used for calculating the standard deviation, as well as warranting an increase in the standard deviation multiplier. With a 20-day SMA and 20-day Standard Deviation, the standard deviation multiplier is set at 2. Bollinger recommends increasing the standard deviation multiplier to 2.1 for a 50-period SMA and decreasing the standard deviation multiplier to 1.9 for a 10-period SMA. **Bollinger Bands reflect direction with the 20-period SMA and volatility with the upper/lower bands**. This means that they can be used to determine whether prices are relatively high or low. Bollinger maintains that the bands should contain 88-89% of price action, rendering a move outside the bands very significant. Technically, prices are relatively high when above the upper band and relatively low when below the lower band. However, relatively high should not be seen as bearish or as a sell signal. Likewise, relatively low should not be regarded as bullish or as a buy signal, since prices are high or low for a reason. As with other indicators, Bollinger Bands are not designed to be used as a stand-alone tool. Traders should combine Bollinger Bands with basic trend analysis and other indicators to confirm a trend.
The calculation is performed in the following manner:
Upper band = middle band + 2 standard deviations Middle band = average of 20 periods Lower band = middle period – 2 standard deviations
More information can be found here: [*BollingerMTF*](/standard-indicators/bollinger-mtf-multitimeframe.md), [*Bollinger Percent %B*](/standard-indicators/bollinger-percent-b-b.md), [*Bollinger Bands Width*](/standard-indicators/bollinger-band-width-bbwidth.md)
#### Further information
VTAD:
Book "Technische Indikatoren - simplified" by Oliver Paesler (German only)
#### Usage
```csharp
Bollinger(double numStdDev, int period)
Bollinger(IDataSeries inSeries, double numStdDev, int period)
//For the upper band
Bollinger(double numStdDev, int period).Upper[int barsAgo]
Bollinger(IDataSeries inSeries, double numStdDev, int period).Upper[int barsAgo]
//For the lower band
Bollinger(double numStdDev, int period).Lower[int barsAgo]
Bollinger(IDataSeries inSeries, double numStdDev, int period).Lower[int barsAgo]
```
#### Return value
**double**
When using this method with an index (e.g. **Bollinger**(2, 20)\[**int** barsAgo] ), the value of the indicator will be displayed for the referenced bar.
#### Parameters
inSeries Input data series for the indicator
numStdDev Standard deviation
period Number of bars included in the calculation
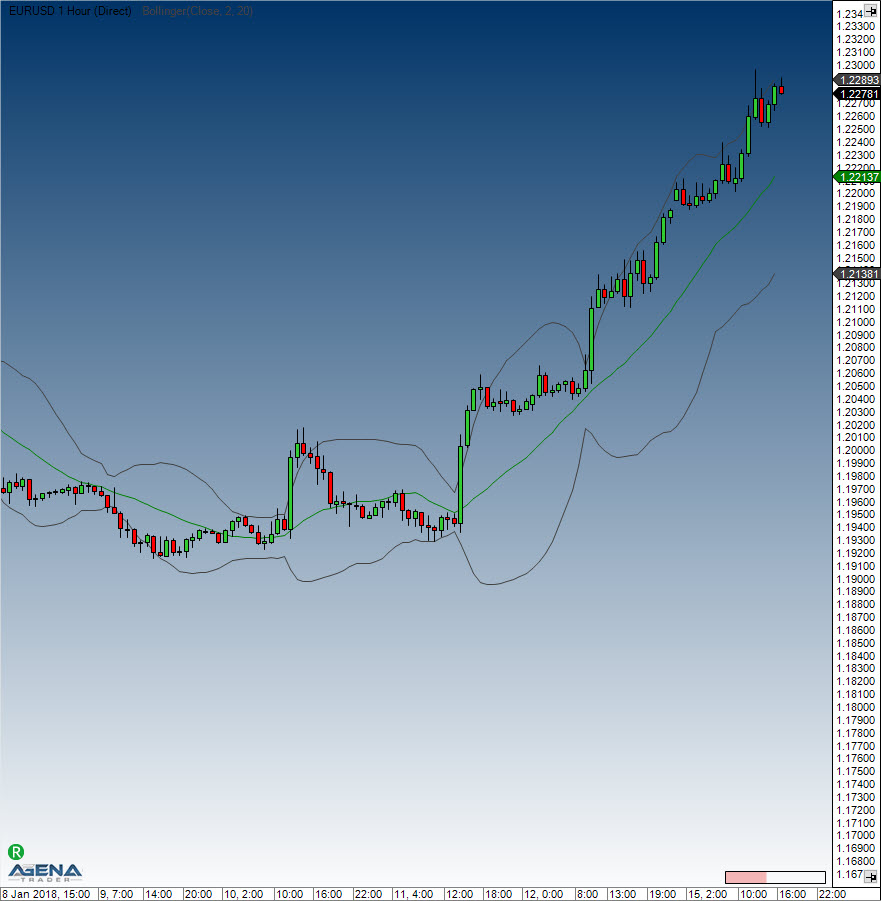
#### Visualization
#### Example
```csharp
//Output of the value for the upper Bollinger Band
Print("Value of the upper band: " + Bollinger(2, 20).Upper[0]);
//Middle band
Print("Value of the middle band: " + Bollinger(2, 20)[0]);
//Lower band
Print("Value of the lower band: " + Bollinger(2, 20).Lower[0]);
```