Indicators
HomeIndicatorsAgenaScriptRelease Notes
  • đź“’AgenaTrader Indicators Introduction
  • STANDARD INDICATORS
    • Accumulation/Distribution (ADL)
    • Adaptive Price Zone (APZ)
    • Aroon
    • Aroon Oscillator
    • Average Directional Index (ADX)
    • Average Directional Movement Rating (ADXR)
    • Average True Range (ATR)
    • BBBreakOutSpeed
    • Balance of Power (BOP)
    • Bollinger Bands
    • Bollinger Percent B (%b)
    • Bollinger Band Width (BBWidth)
    • Bollinger MTF (MultiTimeFrame)
    • BuySellPressure
    • BuySellVolume
    • CandleStickPattern
    • ChaikinMoneyFlow (CMF)
    • Chaikin Oscillator
    • ChaikinVolatility (CVL)
    • Chande Momentum Oscillator (CMO)
    • Climactic Distance
    • Commodity Channel Index (CCI)
    • Directional Movement (DM)
    • Donchian Channel
    • Directional Movement Index (DMI)
    • Double Stochastics (DSS)
    • Dynamic Momentum Index (DMIndex)
    • Ease of Movement (EOM)
    • Fisher Transform
    • Forecast Oscillator (FOSC)
    • HighestHighIndex()
    • HighestHighPrice()
    • IchimokuCloud
    • Keltner Channel
    • KeyReversalUp
    • KeyReversalDown
    • KeyReversalUpAtSMA
    • KeyReversalDownAtSMA
    • KeyReversalUpAtEMA
    • KeyReversalDownAtEMA
    • Linear Regression
    • LinRegIntercept
    • LinRegSlope
    • LowestLowIndex()
    • LowestLowPrice()
    • MACD
    • MAEnvelopes
    • Momentum (MOM)
    • Money Flow Index (MFI)
    • Moving Averages
      • DEMA - Double Exponential Moving Average
      • EMA - Exponential Moving Average
      • EMA MTF (MultiTimeFrame)
      • HMA - Hull Moving Average
      • KAMA - Kaufman's Adaptive Moving Average
      • MAMA - Mesa Adaptive Moving Average
      • SMA - Simple Moving Average
      • GapSMA - Gap Simple Moving Average
      • SMA MTF (MultiTimeFrame)
      • SMMA - Smoothed Moving Average
      • TEMA - Triple Exponential Moving Average
      • TMA - Triangular Moving Average
      • TRIX - Triple Exponential Moving Average
      • T3 - Triple Exponential Moving Average
      • VMA - Variable Moving Average
      • VWMA - Volume Weighted Moving Average
      • WMA - Weighted Moving Average
      • ZLEMA - Zero Lag Exponential Moving Average
    • nBarsUp
    • nBarsDown
    • OnBalanceVolume (OBV)
    • OutsideBars
    • Parabolic SAR
    • Percentage Price Oscillator (PPO)
    • PercentEnvelopes
    • Pivot Points
    • Polarized Fractal Efficiency (PFE)
    • Price Oscillator
    • Rainbow
    • Range
    • Range Indicator (RIND)
    • Rate of Change (ROC)
    • Relative Performance
    • Relative Spread Strength (RSS)
    • Relative Strength Index (RSI)
    • Relative Strength Levy (RSL)
    • Relative Volatility Index (RVI)
    • R-Squared
    • Standard Error (StdError)
    • Stochastics
    • Stochastics Fast
    • Stochastics RSI (StochRSI)
    • Summation (SUM)
    • SuperTrend
    • SupportResistanceAreas
    • Swing
    • Time-Series-Forecast (TSF)
    • Constant Lines
    • CurrentDayOHL
    • Daily Performance
    • DailyQuoteMoves
    • DayLines
    • GetDayBar
    • Info
    • Maximum (MAX)
    • Minimum (MIN)
    • PriceLine
    • PriorDayOHLC
    • PriorDayOHLCext
    • SessionBreakLines
    • ShowBidAsk
    • TickCounter
    • True Strength Index (TSI)
    • Ultimate Oscillator
    • Volume (VOL)
    • Volume Moving Average (VOLMA)
    • Volume Profile
    • Volume Rate of Change (VROC)
    • VolumeUpDown
    • Williams %R
    • ZigZag
  • PREMIUM INDICATORS
    • COT AddOn
      • COTLargeTraderActivity
      • COTStockDummy
      • COTReportLegacy
      • COTReportDisaggregated
      • COTOpenInterestLegacy
      • COTOpenInterestDisaggregated
      • COTCommercialIndex
      • COTAggregatedIndexPositionDisaggregated
    • DowTheory AddOn
      • DayLinesAdv
      • InsideBarsMT
      • MarketPhases
      • MarketPhases Pro
      • MTFBoxes
      • OutsideBars
      • P123
      • P123Pro
      • ReversalBars
    • Darvas AddOn
      • Darvas Boxes
    • Relative Currency Strength (RCS)
    • Volume AddOn
      • KlingerVolumeOscillator
      • Volume Oscillator
      • VolumeArea
      • VolumeGraph
      • VolumeKeltnerChannels
      • VolumeRiseFall
      • VolumeSentimentLong
      • VolumeSentimentShort
      • VolumeSessionPro
      • VolumeTickSpeed
      • VolumeUDR
      • Volume Zones
      • VolumeZoneOscillator
      • WyckoffWave
Powered by GitBook
On this page
Edit on GitLab
  1. STANDARD INDICATORS

Stochastics

Last updated 3 years ago

Description

The stochastic indicator was developed by George C. Lane in the 1950s. It belongs to the class “momentum indicators” (oscillators) and represents the current closing price in relation to a high or low area over a defined number of periods. The stochastic indicator is based on the observation that in an uptrend, the closing price is close to the daily high, while in a downtrend, the closing price is closer to the daily low. The stochastic indicator consists of two exponential Average Lines (%K and %D), both of which range between 0 and 100. There are two types of stochastic: the classic slow stochastic and the fast stochastic.

Fast stochastic: The %D line is the smoothing average of the %K line

Slow stochastic: The %D is the basis on which the smoothing average is calculated. The slow stochastic smoothes the fast stochastic, thus stabilizing the oscillator.

Interpretation

The closing prices found in the upper area imply an accumulation (buying pressure); the lower area represents selling pressure. The stochastic indicator is a classic oscillator, and is primarily used in sideways markets in order to determine the reversal points. Days with a stable trend will not provide the indicator with any relevant or valuable results/information.

Further information

VTAD:

Usage

Stochastics(int periodD, int periodK, int smooth)
Stochastics(IDataSeries inSeries, int periodD, int periodK, int smooth)

//For the %D line
Stochastics(int periodD, int periodK, int smooth).D[int barsAgo]
Stochastics(IDataSeries inSeries, int periodD, int periodK, int smooth).D[int barsAgo]

//For the %K line
Stochastics(int periodD, int periodK, int smooth).K[int barsAgo]
Stochastics(IDataSeries inSeries, int periodD, int periodK, int smooth).K[int barsAgo]

Return value

double

When using this method with an index (e.g. Stochastics(7,14,3)[int barsAgo] ), the value of the indicator will be issued for the referenced bar.

Parameters

inSeries Input data series for the indicator

periodD Number of periods to be used for the %K smoothing

periodK Number of bars included in the %K calculation

smooth Number of periods for the smoothing of %D
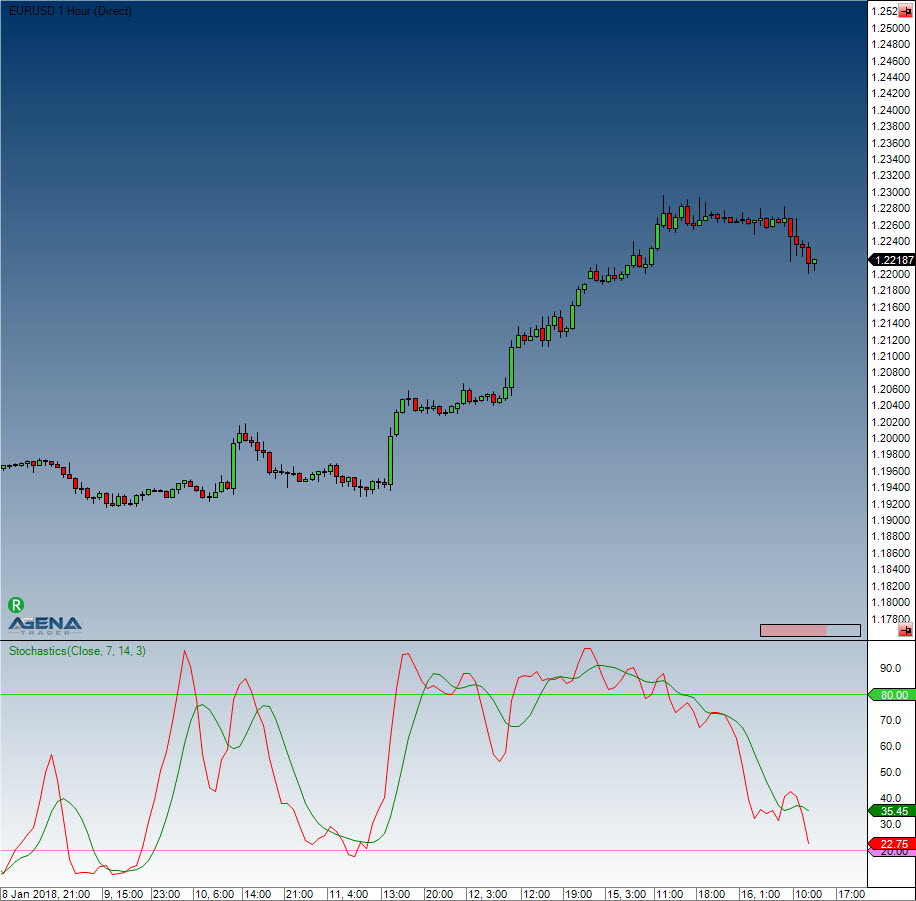
Visualization

Example

//Output for the %K line
Print("The stochastic line %K is currently at: " + Stochastics(3, 14, 7).K[0]);

//Output for the %D line
Print("The stochastic line %D is currently at: " + Stochastics(3, 14, 7).D[0]);
Stochastics
http://vtadwiki.vtad.de/index.php/Stochastik