> For the complete documentation index, see [llms.txt](https://indicators.agenatrader.com/llms.txt). Markdown versions of documentation pages are available by appending `.md` to page URLs; this page is available as [Markdown](https://indicators.agenatrader.com/standard-indicators/macd.md).
# MACD
#### Description
The Moving Average Convergence-Divergence (MACD) indicator, developed by Gerald Appel in the late 70s, is one of the simplest, most effective momentum indicators out there. The MACD makes two trend-following indicators, moving averages, average, become a momentum oscillator by subtracting the longer moving average from the shorter moving average. As a result of this, the MACD offers great advantages: trend following and momentum. The MACD moves above and below the zero line as the moving averages converge, cross and diverge again. Signal line crossovers, centerline crossovers and divergences are things that traders can keep an eye out for to generate signals. Since the MACD is unbounded, it is not especially useful for identifying overbought or oversold levels. The MACD line is the 12-day Exponential Moving Average (EMA) minus the 26-day EMA, and closing prices are used for these moving averages. A 9-day EMA of the MACD line is plotted with the indicator acting as a signal line and identifying turns. The MACD histogram shows the difference between the MACD and its 9-day EMA, i.e. the signal line. When the MACD line is above its signal line, the histogram is positive, and vice versa when the MACD line is below its signal line.
The typical settings used with the MACD are the values 12, 26 and 9. However, other values can also be used depending on the trading style and goals in mind.
#### Interpretation
As its name implies, the MACD is all about the convergence and divergence of the two moving averages. Convergence occurs when the moving averages move towards each other. Divergence occurs when the moving averages move away from each other. The shorter moving average (12-day) is faster and responsible for most MACD movements. The longer moving average (26-day) is slower and less reactive to price changes in the underlying security.
The MACD line oscillates above and below the zero line, which is also known as the centerline. These crossovers signal that the 12-day EMA has crossed the 26-day EMA. The direction, of course, depends on the direction of the moving average cross. Positive MACD indicates that the 12-day EMA is above the 26-day EMA. Positive values increase as the shorter EMA diverges further from the longer EMA. This means upside momentum is increasing. Negative MACD values indicate that the 12-day EMA is below the 26-day EMA. Negative values increase as the shorter EMA diverges further below the longer EMA. This means downside [momentum](https://agenatrader.github.io/AgenaIndicator-documentation/indicators_oscillators/#momentum) is increasing. Signal line crossovers are the most common MACD signals. The signal line is a 9-day EMA of the MACD line. As a moving average of the indicator, it trails the MACD and makes it easier to spot MACD turns. A bullish crossover occurs when the MACD turns up and crosses above the signal line. A bearish crossover occurs when the MACD turns down and crosses below the signal line. Crossovers can last a few days or a few weeks, it all depends on the strength of the move.
Due diligence is required before relying on these common signals. Signal line crossovers at positive or negative extremes should be viewed with caution. Even though the MACD does not have upper and lower limits, chartists can estimate historical extremes with a simple visual assessment. It takes a strong move in the underlying security to push momentum to an extreme. Even though the move may continue, momentum is likely to slow and this will usually produce a signal line crossover at the extremities. Volatility in the underlying security can also increase the number of crossovers.
#### Further information
VTAD:
#### Usage
```csharp
MACD(int fast, int slow, int smooth)
MACD(IDataSeries inSeries, int fast, int slow, int smooth)
//For the value of the MACD line
MACD(int fast, int slow, int smooth)[int barsAgo]
MACD(IDataSeries inSeries, int fast, int slow, int smooth)[int barsAgo]
//For the value of the signal line
MACD(int fast, int slow, int smooth).Avg[int barsAgo]
MACD(IDataSeries inSeries, int fast, int slow, int smooth).Avg[int barsAgo]
//For the difference between the MACD and the signal line
MACD(int fast, int slow, int smooth).Diff[int barsAgo]
MACD(IDataSeries inSeries, int fast, int slow, int smooth).Diff[int barsAgo]
```
#### Return value
**double**
When using this method with an index (e.g. **MACD**(12,26,9)\[**int** barsAgo] ), the value of the indicator will be issued for the referenced bar.
#### Parameters
inSeries Input data series for the indicator
fast Number of periods for the fast EMA calculation
slow Number of periods for the slow EMA calculation
smooth Number of periods for the EMA calculation of the signal line
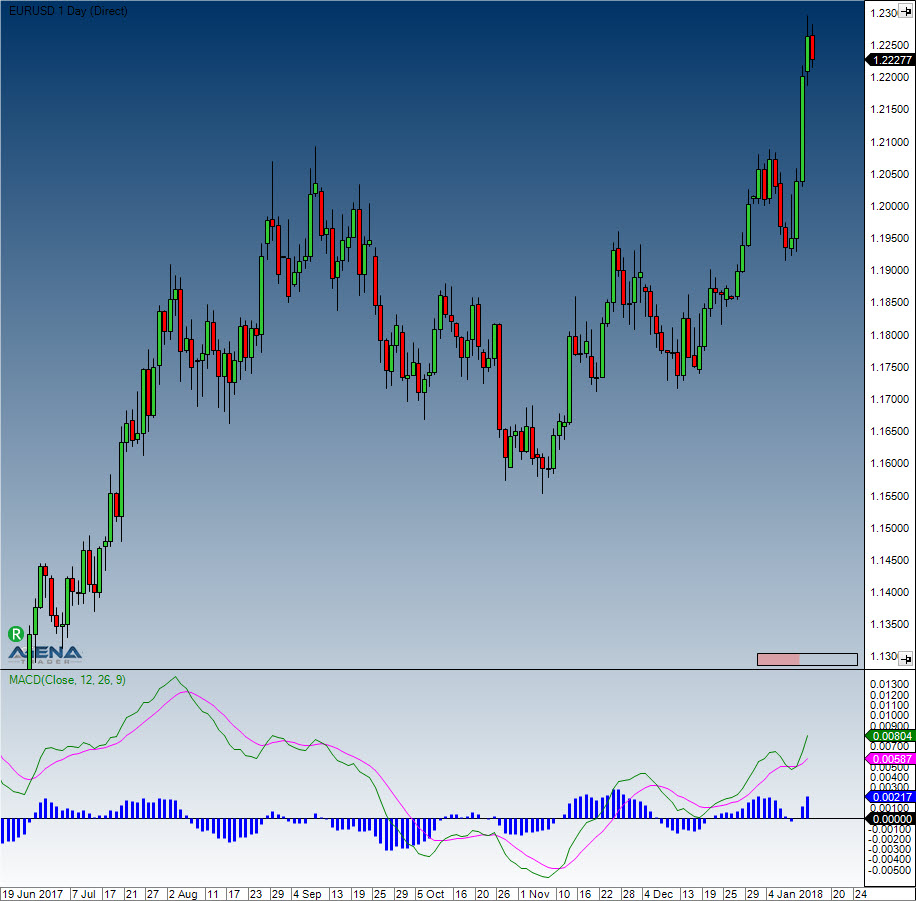
#### Visualization
#### Example
```csharp
//Show the current values for the MACD
Print("The current value for the MACD line is: " + MACD(12,26,9)[0]);
Print("The current value for the signal line is: " + MACD(12,26,9).Avg[0]);
Print("The difference between the MACD and the signal line is: " + MACD(12,26,9).Diff[0]);
```