> For the complete documentation index, see [llms.txt](https://indicators.agenatrader.com/llms.txt). Markdown versions of documentation pages are available by appending `.md` to page URLs; this page is available as [Markdown](https://indicators.agenatrader.com/standard-indicators/supportresistanceareas.md).
# SupportResistanceAreas
#### Description
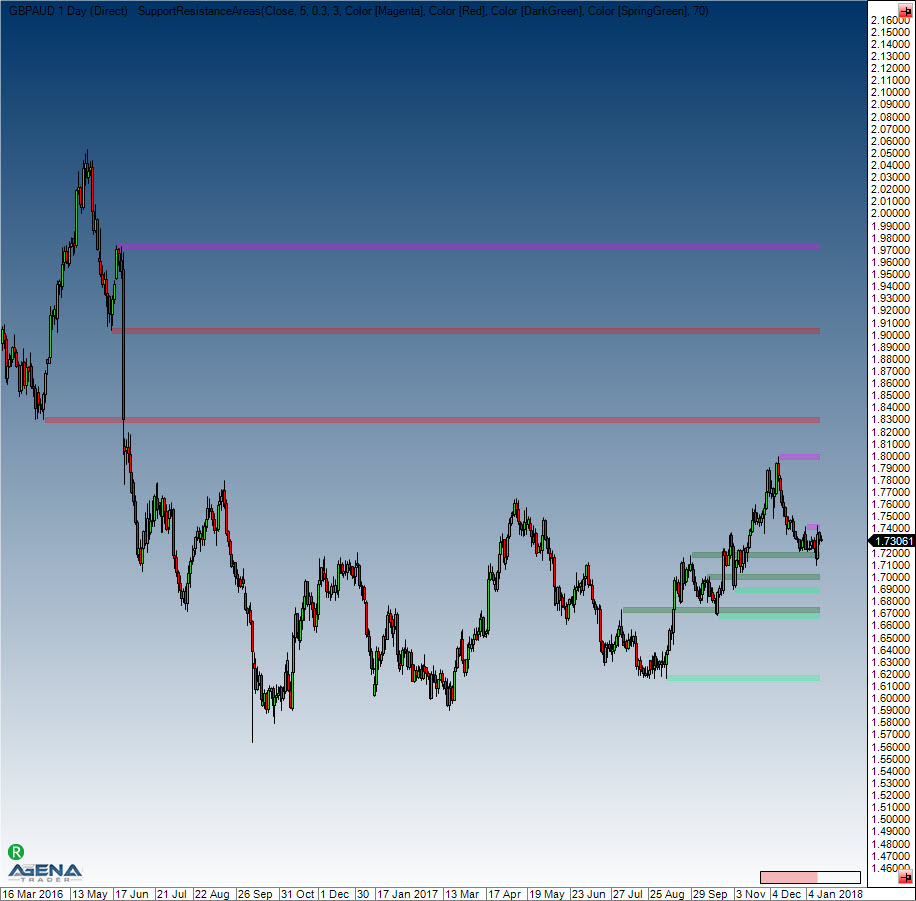
This indicator draws support and resistance areas in the chart. There are 4 different types of possible supports and resistances, which are differentiated by various colors.
Support due to a lower high (ColorLowerHigh)
Support due to a lower low (ColorLowerLow)
Resistance due to a higher high (ColorHigherHigh)
Resistance due to a higher low (ColorHigherLow)
#### Interpretation
S/R zones play an important role in technical analysis. Clearly defined and identifiable support areas provide favorable entry opportunities, while resistance areas provide target zones to exit those trades. Once broken, these areas tend to reverse their function, meaning that a broken support zone becomes a resistance zone.
#### Parameters
| | |
| ------------------------------------------------------ | ------------------------------------------------------------------------------------------------ |
| ATRRangeFactor | Settings for the width of the support/resistance area as calculated by the ATR. |
| The smallest configurable value is 0.1; default is 0.3 | |
| Levels | This setting defines how many S/R zones of the same type are displayed. The default is 3 |
| Opacity | Transparency of the bars to be drawn into the chart; 0 (transparent) – 255 (completely visible). |
| Default is 70 | |
| SensibilityFactor | Defines the sensitivity of the S/R search. |
| The smallest setting is 1; the default is 5 | |
#### Visualization