> For the complete documentation index, see [llms.txt](https://indicators.agenatrader.com/llms.txt). Markdown versions of documentation pages are available by appending `.md` to page URLs; this page is available as [Markdown](https://indicators.agenatrader.com/standard-indicators/keltner-channel.md).
# Keltner Channel
#### Description
Keltner Channels are volatility-based envelopes placed above and below an EMA. This indicator shares similarities with Bollinger Bands, where the bands are set using the standard deviation. Here, instead of using the standard deviation, Keltner Channels use the Average True Range (ATR) to set the channel distance. Typically, the channels are set two Average True Range values above and two ATRs below the 20-day EMA. The EMA determines the direction and the Average True Range dictates the channel width. Keltner Channels form a trend-following indicator that is applied with the aim of identifying reversals with channel breakouts and channel direction. The channels can also be used to spot overbought and oversold levels when the trend is flat. In his 1960 book, *How to Make Money in Commodities,* Chester Keltner featured the "Ten-Day Moving Average Trading Rule," credited as the original version of Keltner Channels. This version started off with a 10-day SMA of the typical price {(H+L+C)/3)} as the center line. The 10-day SMA of the high-low range was added and subtracted to set the upper and lower channel lines respectively. Linda Bradford Raschke then brought in the more recent version of Keltner Channels in the 1980s. Similarly to Bollinger Bands, this new version made use of a volatility-based indicator, Average True Range (ATR), to set channel width. Middle line = 20-day exponential moving average Upper channel line: 20-day EMA + (2x ATR(10)) Lower channel line: 20-day EMA – (2xATR(10))
#### Interpretation
Indicators based on channels, bands and envelopes are designed to encompass most price action. Therefore, moves above or below the channel lines warrant attention because they are relatively rare. Trends often start with strong moves in one direction or another. A surge above the upper channel line shows extraordinary strength, while a plunge below the lower channel line shows extraordinary weakness. Such strong moves can signal the end of one trend and the beginning of another.
With an exponential *moving average*, *average* as their foundation, the Keltner Channels are a trend-following indicator. As with moving averages and trend-following indicators, Keltner Channels lag price action. The direction of the moving average dictates the direction of the channel. In general, a downtrend is present when the channel moves lower, while an uptrend exists when the channel moves higher. The trend is flat when the channel moves sideways.
A channel upturn and break above the upper trend line can signal the start of an uptrend. A channel downturn and break below the lower trend line can signal the start a downtrend. Sometimes a strong trend does not take hold after a channel breakout and prices oscillate between the channel lines. Such trading ranges are marked by a relatively flat moving average. The channel boundaries can then be used to identify overbought and oversold levels for trading purposes.
#### Further information
VTAD:
#### Usage
```csharp
KeltnerChannel(double offsetMutiplier, int period)
KeltnerChannel(IDataSeries inSeries, double offsetMutiplier, int period)
//Returns midline value
KeltnerChannel(double offsetMutiplier, int period)[int barsAgo]
KeltnerChannel(IDataSeries inSeries, double offsetMutiplier, int period)[int barsAgo]
//Returns upper band value
KeltnerChannel(double offsetMutiplier, int period).Upper[int barsAgo]
KeltnerChannel(IDataSeries inSeries, double offsetMutiplier, int period).Upper[int barsAgo]
//Returns lower band value
KeltnerChannel(double offsetMutiplier, int period).Lower[int barsAgo]
KeltnerChannel(IDataSeries inSeries, double offsetMutiplier, int period).Lower[int barsAgo]
```
#### Return value
**double**
When using this method with an index (e.g. **KeltnerChannel**(1.5, 15)\[**int** barsAgo] ), the value of the indicator will be issued for the referenced bar.
#### Parameters
inSeries Input data series for the indicator
offsetMultiplier Multiplier for the SMA
period Number of bars included in the calculations
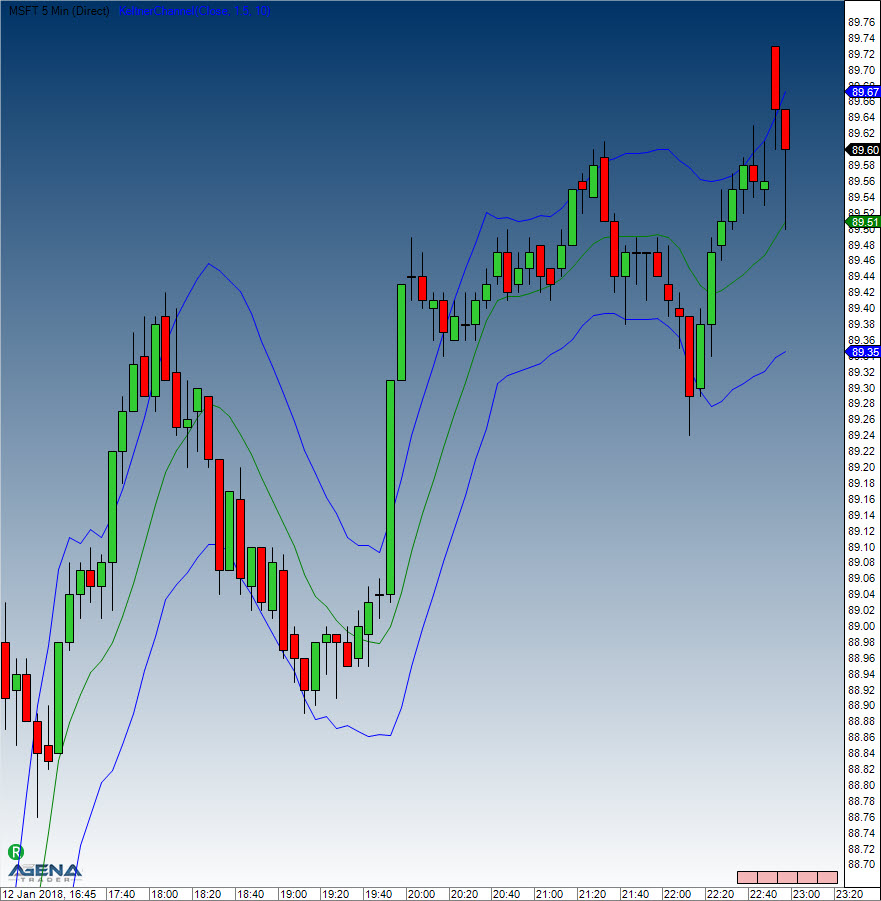
#### Visualization
#### Calculation
diff.**Set**(High\[0] - Low\[0]);
**double** middle = **SMA**(Typical, Period)\[0];
**double** offset = **SMA**(diff, Period)\[0] \* offsetMultiplier;
**double** upper = middle + offset;
**double** lower = middle - offset;
#### Example
```csharp
//Current value for the Keltner Channel based on 15 periods
Print("Current value of the upper Keltner Channel band: " + KeltnerChannel(1.5, 15).Upper[0]);
Print("Current value of the middle Keltner Channel band: " + KeltnerChannel(1.5, 15)[0]);
Print("Current value of the lower Keltner Channel band: " + KeltnerChannel(1.5, 15).Lower[0]);
```