Indicators
HomeIndicatorsAgenaScriptRelease Notes
  • 📒AgenaTrader Indicators Introduction
  • STANDARD INDICATORS
    • Accumulation/Distribution (ADL)
    • Adaptive Price Zone (APZ)
    • Aroon
    • Aroon Oscillator
    • Average Directional Index (ADX)
    • Average Directional Movement Rating (ADXR)
    • Average True Range (ATR)
    • BBBreakOutSpeed
    • Balance of Power (BOP)
    • Bollinger Bands
    • Bollinger Percent B (%b)
    • Bollinger Band Width (BBWidth)
    • Bollinger MTF (MultiTimeFrame)
    • BuySellPressure
    • BuySellVolume
    • CandleStickPattern
    • ChaikinMoneyFlow (CMF)
    • Chaikin Oscillator
    • ChaikinVolatility (CVL)
    • Chande Momentum Oscillator (CMO)
    • Climactic Distance
    • Commodity Channel Index (CCI)
    • Directional Movement (DM)
    • Donchian Channel
    • Directional Movement Index (DMI)
    • Double Stochastics (DSS)
    • Dynamic Momentum Index (DMIndex)
    • Ease of Movement (EOM)
    • Fisher Transform
    • Forecast Oscillator (FOSC)
    • HighestHighIndex()
    • HighestHighPrice()
    • IchimokuCloud
    • Keltner Channel
    • KeyReversalUp
    • KeyReversalDown
    • KeyReversalUpAtSMA
    • KeyReversalDownAtSMA
    • KeyReversalUpAtEMA
    • KeyReversalDownAtEMA
    • Linear Regression
    • LinRegIntercept
    • LinRegSlope
    • LowestLowIndex()
    • LowestLowPrice()
    • MACD
    • MAEnvelopes
    • Momentum (MOM)
    • Money Flow Index (MFI)
    • Moving Averages
      • DEMA - Double Exponential Moving Average
      • EMA - Exponential Moving Average
      • EMA MTF (MultiTimeFrame)
      • HMA - Hull Moving Average
      • KAMA - Kaufman's Adaptive Moving Average
      • MAMA - Mesa Adaptive Moving Average
      • SMA - Simple Moving Average
      • GapSMA - Gap Simple Moving Average
      • SMA MTF (MultiTimeFrame)
      • SMMA - Smoothed Moving Average
      • TEMA - Triple Exponential Moving Average
      • TMA - Triangular Moving Average
      • TRIX - Triple Exponential Moving Average
      • T3 - Triple Exponential Moving Average
      • VMA - Variable Moving Average
      • VWMA - Volume Weighted Moving Average
      • WMA - Weighted Moving Average
      • ZLEMA - Zero Lag Exponential Moving Average
    • nBarsUp
    • nBarsDown
    • OnBalanceVolume (OBV)
    • OutsideBars
    • Parabolic SAR
    • Percentage Price Oscillator (PPO)
    • PercentEnvelopes
    • Pivot Points
    • Polarized Fractal Efficiency (PFE)
    • Price Oscillator
    • Rainbow
    • Range
    • Range Indicator (RIND)
    • Rate of Change (ROC)
    • Relative Performance
    • Relative Spread Strength (RSS)
    • Relative Strength Index (RSI)
    • Relative Strength Levy (RSL)
    • Relative Volatility Index (RVI)
    • R-Squared
    • Standard Error (StdError)
    • Stochastics
    • Stochastics Fast
    • Stochastics RSI (StochRSI)
    • Summation (SUM)
    • SuperTrend
    • SupportResistanceAreas
    • Swing
    • Time-Series-Forecast (TSF)
    • Constant Lines
    • CurrentDayOHL
    • Daily Performance
    • DailyQuoteMoves
    • DayLines
    • GetDayBar
    • Info
    • Maximum (MAX)
    • Minimum (MIN)
    • PriceLine
    • PriorDayOHLC
    • PriorDayOHLCext
    • SessionBreakLines
    • ShowBidAsk
    • TickCounter
    • True Strength Index (TSI)
    • Ultimate Oscillator
    • Volume (VOL)
    • Volume Moving Average (VOLMA)
    • Volume Profile
    • Volume Rate of Change (VROC)
    • VolumeUpDown
    • Williams %R
    • ZigZag
  • PREMIUM INDICATORS
    • COT AddOn
      • COTLargeTraderActivity
      • COTStockDummy
      • COTReportLegacy
      • COTReportDisaggregated
      • COTOpenInterestLegacy
      • COTOpenInterestDisaggregated
      • COTCommercialIndex
      • COTAggregatedIndexPositionDisaggregated
    • DowTheory AddOn
      • DayLinesAdv
      • InsideBarsMT
      • MarketPhases
      • MarketPhases Pro
      • MTFBoxes
      • OutsideBars
      • P123
      • P123Pro
      • ReversalBars
    • Darvas AddOn
      • Darvas Boxes
    • Relative Currency Strength (RCS)
    • Volume AddOn
      • KlingerVolumeOscillator
      • Volume Oscillator
      • VolumeArea
      • VolumeGraph
      • VolumeKeltnerChannels
      • VolumeRiseFall
      • VolumeSentimentLong
      • VolumeSentimentShort
      • VolumeSessionPro
      • VolumeTickSpeed
      • VolumeUDR
      • Volume Zones
      • VolumeZoneOscillator
      • WyckoffWave
Powered by GitBook
On this page
Edit on GitLab
  1. STANDARD INDICATORS

Ultimate Oscillator

Description

Larry Williams developed the Ultimate Oscillator, which was first published in 1985. The Ultimate Oscillator is calculated by means of taking the weighted sum of three oscillators in different timeframes. These three timeframes are the short-term, middle and long-term market cycles. The typical period lengths used are 7, 14 and 28, and the value of the indicator moves between 0 and 100. Values above 70 signify an overbought situation, and values below 30 show that it is oversold.

Interpretation

Williams defined the following criteria for a buy signal:

A bullish divergence between price and oscillator can be observed, meaning that the market makes a new low but the oscillator remains unchanged.

While this divergence is forming, the oscillator falls below 30.

The oscillator will then resume its upward move towards the high at which it peaked before the divergence began forming.

The buy signal is created when the price breaches that last high.

The long position is closed if the oscillator rises above 70 or if the oscillator rises above 50 and then falls back below 45. A sell signal consists of bearish divergences forming above 70. These positions are closed once the 30 level marker is breached.

Usage

UltimateOscillator(int fast, int intermediate, int slow)
UltimateOscillator(IDataSeries inSeries, int fast, int intermediate, int slow)
UltimateOscillator(int fast, int intermediate, int slow)[int barsAgo]
UltimateOscillator(IDataSeries inSeries, int fast, int intermediate, int slow)[int barsAgo]

Return value

double

When using this method with an index (e.g. UltimateOscillator (5)[int barsAgo] ), the value of the indicator will be issued for the referenced bar.

Parameters

inSeries

Input data series for the indicator

fast

Number of bars for the calculation of the short-term oscillator

intermediate

Number of bars for the calculation of the intermediate oscillator

slow

Number of bars for the calculation of the slow indicator
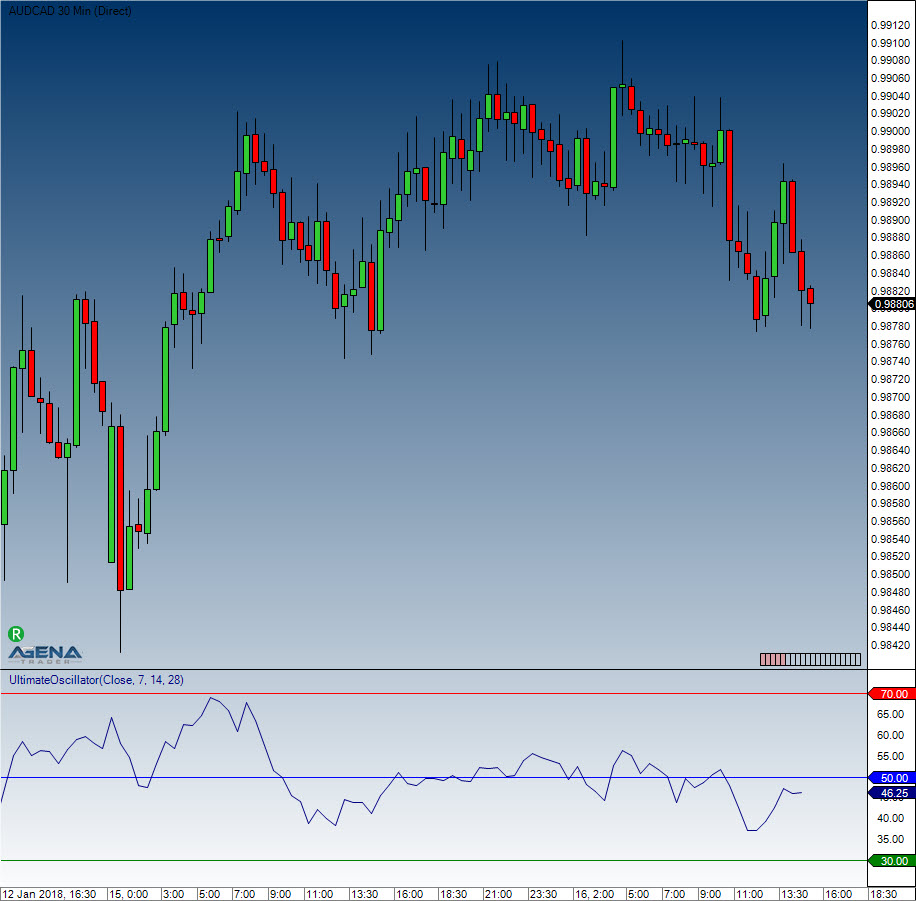
Visualization

Example

// Output of the values for the UltimateOscillator with settings of 7,14,28
Print("The current value for the Ultimate Oscillator is " + UltimateOscillator(7, 14, 28)[0]);

Last updated 3 years ago

Ultimate Oscillator