> For the complete documentation index, see [llms.txt](https://indicators.agenatrader.com/llms.txt). Markdown versions of documentation pages are available by appending `.md` to page URLs; this page is available as [Markdown](https://indicators.agenatrader.com/standard-indicators/pivot-points.md).
# Pivot Points
#### Description
This indicator, based on the price zone approach invented by Dr. Bruce Gould, has been honed over the years. In the beginning, the price zones were calculated using the price developments of the last 2-3 years. Nowadays, however, the practical concept of pivot points is taken from the calculation of price zones in the daily chart, using the previous day’s periods as the basis. The goal hereby is to determine price levels that one could use as potential resistance zones (R1..R3) or support zones (S1..S3). The following methods can be used to calculate the indicator: Classic, Floor, Woodie, Camarilla, Fibonacci. The Classic and Floor methods are often wrongly named within literature, which is why in AgenaTrader you will find that the Classic method is labeled as “Floor” and vice versa. The indicator displays the pivot points for intraday charts, and the parameter “ShowPrices” allows you to display the price on the levels. The parameter “DaysBack” allows you to set the number of periods in the past that should be used for the calculation. The line coloring can be defined manually
#### Interpretation
Traders prefer to sell above the resistance lines 1 & 2 (e.g. to build up short positions), and to start building up tactical long positions at the support lines.
#### Further information
#### Usage
```csharp
PivotPoints()
PivotPoints(PivotPointsMode mode)
PivotPoints(PivotPointsMode mode, int LineWidth, bool ShowPrices, int DaysBack, Color RColor, Color PPColor, Color SColor)
PivotPoints(IDataSeries inSeries, PivotPointsMode mode, int LineWidth, bool ShowPrices, int DaysBack, Color RColor, Color PPColor, Color SColor)
PivotPoints()[barsAgo]
PivotPoints(PivotPointsMode mode)[barsAgo]
PivotPoints(PivotPointsMode mode, int LineWidth, bool ShowPrices, int DaysBack, Color RColor, Color PPColor, Color SColor)[barsAgo]
PivotPoints(IDataSeries inSeries, PivotPointsMode mode, int LineWidth, bool ShowPrices, int DaysBack, Color RColor, Color PPColor, Color SColor)[barsAgo]
```
#### Return value
This class has the following public methods (as data series), which all return double values:
**PP, S1, S2, S3, R1, R2 ,R3**
#### Example:
```csharp
PivotPoints().PP[int barsAgo]
PivotPoints(PivotPointsMode.Classic).S3[int barsAgo]
```
#### Parameters
| | |
| ------------------------- | ------------------------------------------------------------------------------------------- |
| InSeries | Input data series for the indicator |
| PivotPointsMode | Calculatory method. Default: floor |
| PivotPointsMode.Classic | |
| PivotPointsMode.Floor | |
| PivotPointsMode.Woodie | |
| PivotPointsMode.Camarilla | |
| PivotPointsMode.Fibonacci | |
| LineWidth | Default: 1 |
| ShowPrices | Shows prices next to the lines. Default:false |
| DaysBack | The number of historical periods to be included in the display of the pivot lines Default:0 |
| RColor | Resistance line color |
| PPColor | Pivot line color |
| SColor | Support line color |
| Show Regions | Color fill space between lines |
| Extend Lines to Future | Extend lines to latest data |
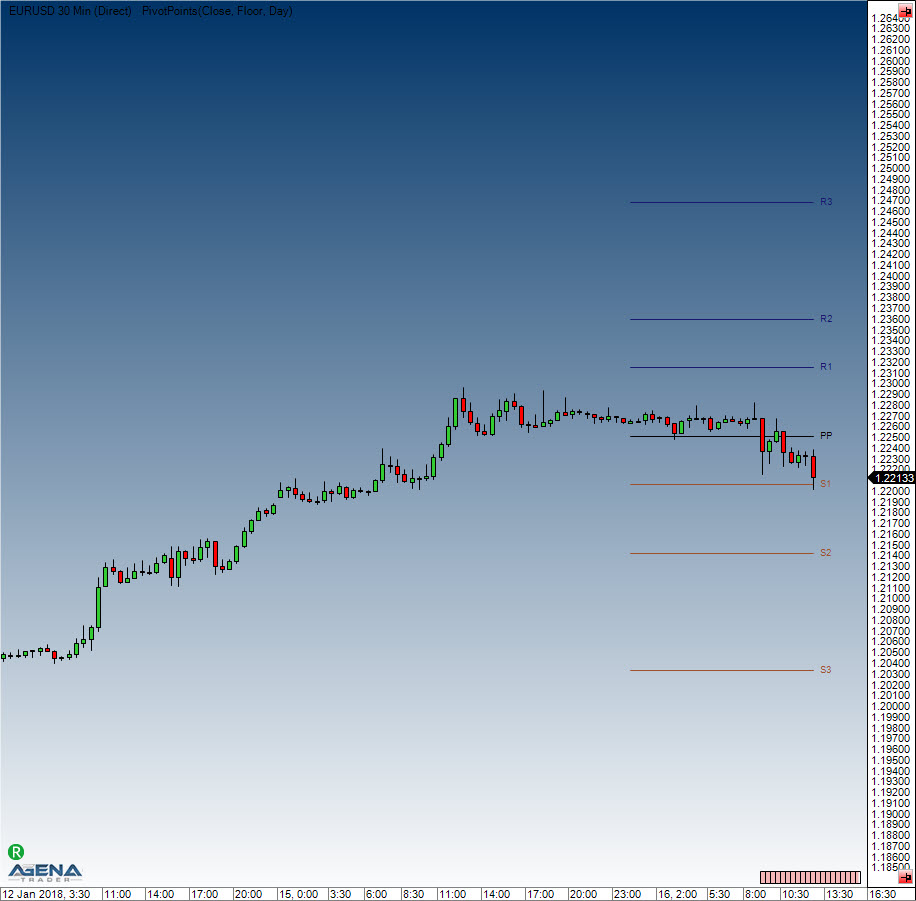
#### Visualization
#### Example
```csharp
//Output current pivot point
Print("The floor pivot point is located at: " + PivotPoints()[0]);
//Output first support (S1)
Print("The first pivot support (S1) is at: " + PivotPoints().S1[0]);
```
#### Calculation
H=yesterday’s high, L=yesterday’s low, O=yesterday’s open, C=yesterday’s close
Range = H-L
**Classic**
pp = (H + L + C)/3
r1 = 2\*pp - L
s1 = 2\*pp - H
r2 = pp - s1 + r1
s2 = pp - r1 + s1
r3 = H + 2\*(pp - L)
s3 = L - 2\*(H - pp)
**Floor**
pp = (H + L + C)/3
r1 = 2\*pp - L
s1 = 2\*pp - H
r2 = pp + Range
s2 = pp - Range
r3 = pp + 2\*Range
s3 = pp - 2\*Range
**Woodie**
pp = (H + L + 2\*C)/4
r1 = 2\*pp - L
s1 = 2\*pp - H
r2 = pp + H - L
s2 = pp - H + L
r3 = 0.0
s3 = 0.0
**Camarilla**
pp = (H + L + C)/3
r1 = C + Range \* 1.1 / 12
s1 = C - Range \* 1.1 / 12
r2 = C + Range \* 1.1 / 6
s2 = C - Range \* 1.1 / 6
r3 = C + Range \* 1.1 / 4
s3 = C - Range \* 1.1 / 4
**Fibonacci**
pp = (H + L + C)/3
r1 = pp + 0.382 \* Range
s1 = pp - 0.382 \* Range
r2 = pp + 0.618 \* Range
s2 = pp - 0.618 \* Range
r3 = pp + 0.764 \* Range
s3 = pp - 0.764 \* Range