> For the complete documentation index, see [llms.txt](https://indicators.agenatrader.com/llms.txt). Markdown versions of documentation pages are available by appending `.md` to page URLs; this page is available as [Markdown](https://indicators.agenatrader.com/standard-indicators/constant-lines.md).
# Constant Lines
#### Description
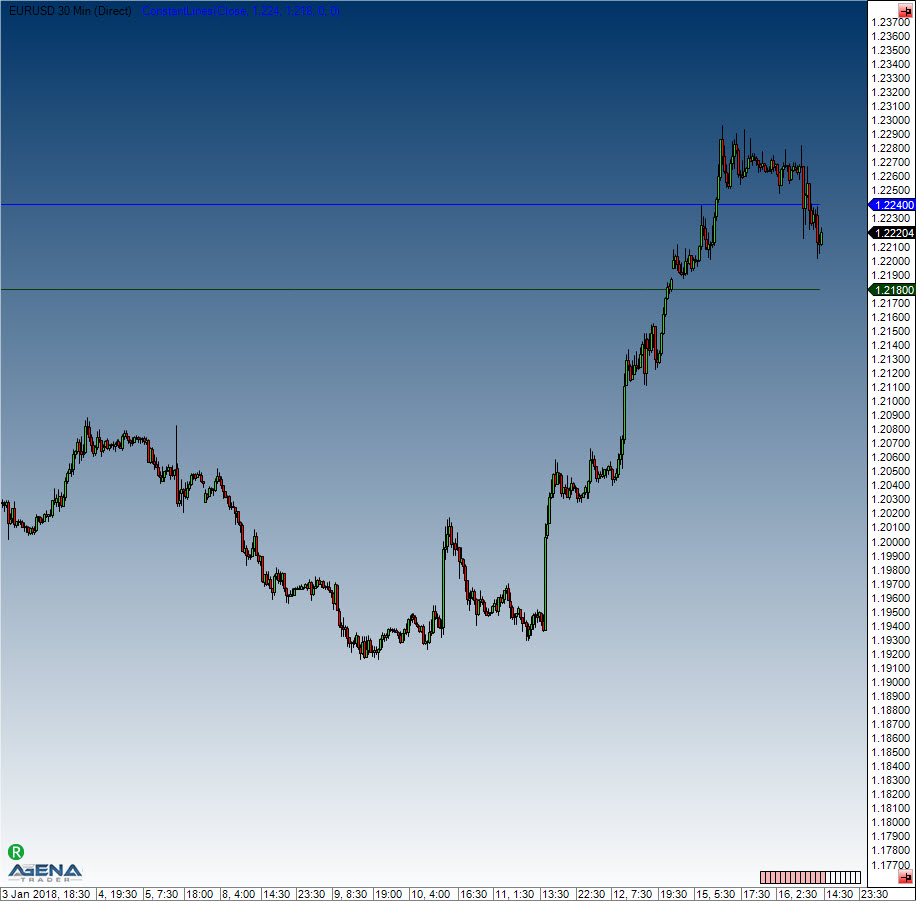
The Constant Lines tool can draw a maximum of four freely configurable horizontal lines within a chart. In general, it is used to label certain price levels in order to keep an eye on them.
#### Usage
```csharp
ConstantLines(double line1Value, double line2Value, double line3Value, double line4Value)
ConstantLines(double line1Value, double line2Value, double line3Value, double line4Value)[barsAgo]
ConstantLines(double line1Value, double line2Value, double line3Value, double line4Value).Line1[barsAgo]
ConstantLines(double line1Value, double line2Value, double line3Value, double line4Value).Line2[barsAgo]
ConstantLines(double line1Value, double line2Value, double line3Value, double line4Value).Line3[barsAgo]
ConstantLines(double line1Value, double line2Value, double line3Value, double line4Value).Line4[barsAgo]
```
#### Return value
**double**
When using this method with an index (e.g. **ConstantLines**(1,2,3,4)\[**int** barsAgo] ), the value of the indicator will be issued for the referenced bar.
#### Visualization