> For the complete documentation index, see [llms.txt](https://indicators.agenatrader.com/llms.txt). Markdown versions of documentation pages are available by appending `.md` to page URLs; this page is available as [Markdown](https://indicators.agenatrader.com/premium-indicators/dowtheory-addon/marketphases.md).
# MarketPhases
**The installation of the Dow Theory Standard or Professional Package is required in order to access this indicator.**
#### Description
The Market Phases Indicator is another important component of the Technical Analysis Package, and is based on integrated trend detection for the various relevant trading market phases.
The market phases are defined according to the book series “Der Händler” (“The Trader”) by Michael Voigt.
**Important tip** MarketPhases indicators are very history sensitive and need at least up to 2000 intraday candles to see good results.
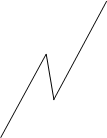
**Phase 3:**
The market is located far away from the movement; a correction is imminent.
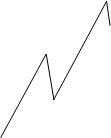
**Phase 4:**
The market is in correction mode. The original trend direction has not yet resumed. During the uptrend, further lows may occur, and in a downtrend, further highs may occur.
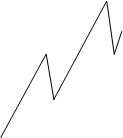
**Phase 5:**
The market is coming out of the correction and will resume its trend direction.
**Phase 5+**
The market is in Phase 5. In addition, the sub-trend is confirming a 1-2-3 pattern.
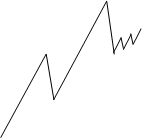
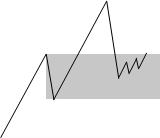
**Phase 5+ (Prom Queen)**
The term Prom Queen is also taken from the book series “*Der Händler*”. A 5+ trend phase is classified by an uptrend correction move running up to point 2. The correction zone is marked in grey in the following image.
Market phases 1, 2, 6, and 9 are not relevant for successful trading.
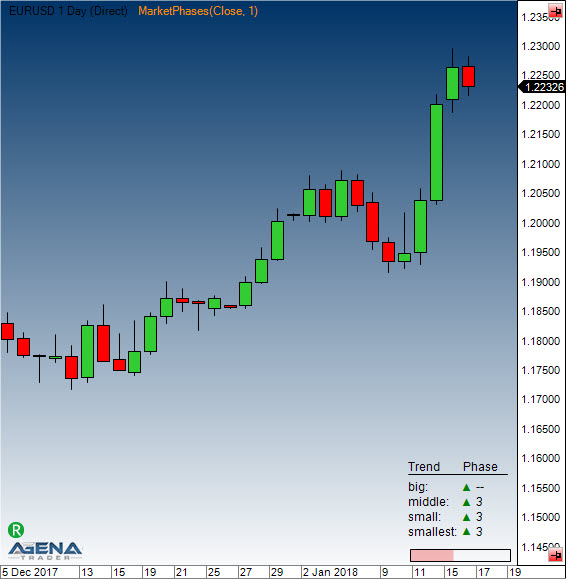
#### Depiction in the chart
No parameters are required.
#### Usage in AgenaScript
The indicator provides the following values for the market phases:
Phase 3: 3
Phase 4: 4
Phase 5: 5
Phase 5+ 5.1
Prom Queen 5.2
In a downtrend, the values are prefixed with a “-“ sign. If the market phase is not defined, then the value 0 is returned.
```csharp
MarketPhases(int trendSize)[barsAgo]
```
**Parameter**
trendsize: trend size from 0 .. 3
**Caution:**
For a comparison of double values such as: **if** (**MarketPhases**(1)\[0] == 5.1) ...we recommend that you use the following instead:
```csharp
bool goLong = Math.Abs(MarketPhases(1)[0] - 5.1) <= Double.Epsilon;
```
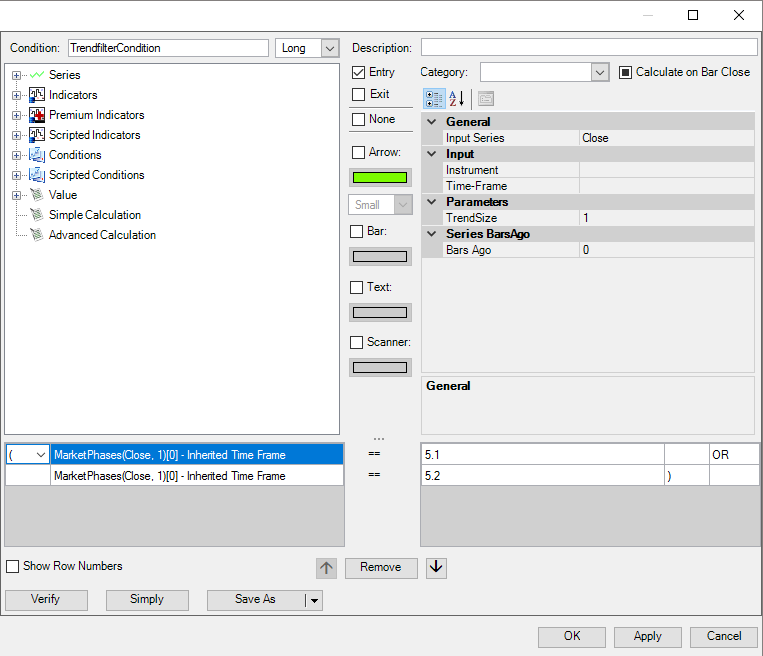
#### Usage within the Condition Escort
When using market phases within AgenaScript, the indicator provides a data series that has the aforementioned values of +/-3, 4, 5, 5.1, 5.2.
You can use the indicator as a filter by using the signals of other indicators when they are inside the market phases 5.1 or 5.2(long):
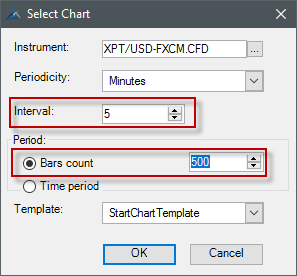
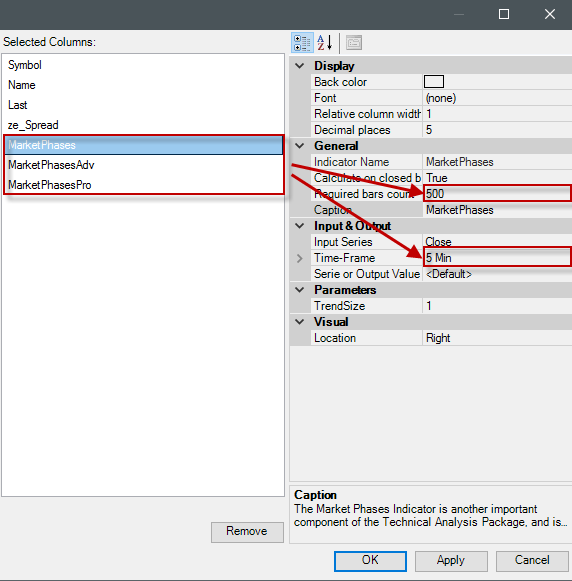
**Important tip** The scanner and chart use a different history calculation. Since Dow Theory indicators are very bar sensitive we cannot guarantee 100% synchronization between results show in the chart and the scanner. We recommend to reload the data in the scanner from time to time to avoid to big discrepancies. If you want to use MarketPhases (also Pro and Advanced version) indicator in conjunction with the scanner, the following settings are required:
* Chart settings:
* Bars count
* Time frame
* Scanner column settings:
* Bars required
* Time frame
These chart and column settings should be identical.
####