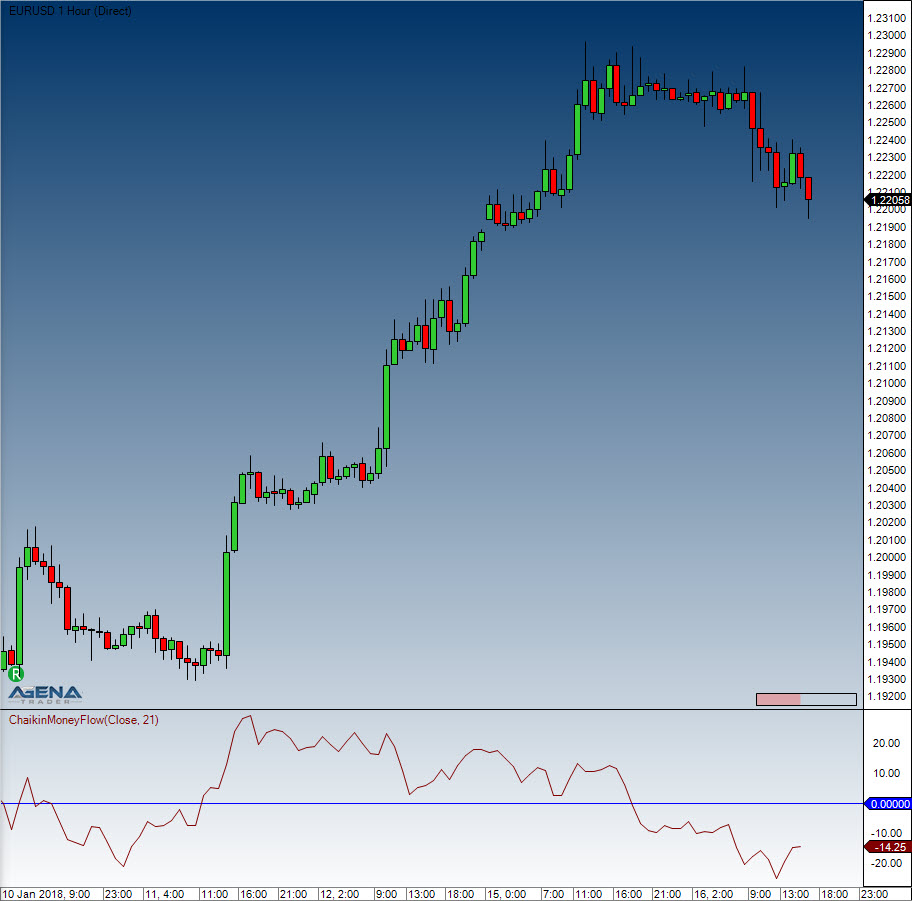
ChaikinMoneyFlow (CMF)
Description
Marc Chaikin was the one to develop the Chaikin Money Flow Index, which is a volume indicator that tries to find an answer to the following question: Where is the money flowing into? Into the stock = accumulation, and out of the stock = distribution. Clearly, this applies not only to stocks/shares but also to other instruments. With this, Chaikin attempts to expand on and improve the On-Balance Volume that was developed by Granville. Using the CMF, the position of the closing price within the trading range is placed in relation to the volume. What this essentially means is that the trading volume is multiplied by the price. The trading volume displays the amount of money that has “flowed” into the stock or has been “removed” from the stock; the indicator simply displays whether it has been accumulated (buying pressure) or removed (distribution).
Interpretation
The CMF oscillates around the zero line and is shown in a separate window with an open scale. Should the CMF be located above the zero line, then it can be interpreted as accumulation. If higher highs are being created, then the buying pressure is increasing. The reverse is true for the selling pressure. The Chaikin Money Flow should always be used in combination with other methods of technical analysis.
Further information
VTAD: http://vtadwiki.vtad.de/index.php/Chaikin_Money_Flow
Usage
Return value
double
When using this method with an index (e.g. ChaikinMoneyFlow(21)[int barsAgo] ), the value of the indicator will be outputted for the referenced bar.
Parameters
inSeries Input data series for the indicator
period Number of bars included in the calculation
Visualization
Example
Last updated