> For the complete documentation index, see [llms.txt](https://indicators.agenatrader.com/llms.txt). Markdown versions of documentation pages are available by appending `.md` to page URLs; this page is available as [Markdown](https://indicators.agenatrader.com/standard-indicators/ichimokucloud.md).
# IchimokuCloud
#### Description
The Ichimoku Cloud, also called Ichimoku Kinko Hyo, is a very adaptable indicator that defines support and resistance, gauges momentum, identifies trend direction and provides trading signals. Ichimoku Kinko Hyo literally means "one look equilibrium chart". With just one look, traders can identify the trend and search for possible signals in that trend. The indicator was developed by the journalist Goichi Hosoda, and published in his 1969 book. Although the Ichimoku Cloud may appear complicated when looked at on the price chart, it is in fact a simple indicator that can be implemented very well – a tribute to the fact that its inventor was a journalist! What is more, the concepts are easily understandable and the signals well-defined.
**1. Tenkan Sen** – conversion line This is the median value of the 9-period high and the 9-period low. **2. Kinjun Sen** – the baseline This is the midpoint of the 26-period high and low. **3. Chikou Span** – lagging span This is the closing price plotted 26 days in the past. **4. Senkou Span A** – the first leading line This is the midpoint between the conversion line and the baseline. The leading Span A forms one of the two cloud boundaries. It is referred to as leading because it is plotted 26 periods in the future and thus builds the faster cloud boundary. **5. Senkou Span B** – the second leading line This is the midpoint of the 52-day high-low range projected 26 periods into the future, forming the slower cloud boundary. Kumo – cloud The cloud (Kumo) is the area between Senkou Span A and Senkou Span B. This area is highlighted in color, forming a cloud shape.
**Caution:** Because the cloud is drawn “into the future”, it is necessary to shift the time axis to the left in order to view it.
#### Interpretation
Similarly to the smoothing averages, the Ichimoku indicator will create a bullish signal when the Tenkan Sen crosses over the Kinjun Sen from below.
#### Further information
(Part 1, German)
(Part 2, German)
#### Usage
```csharp
IchimokuCloud(int periodFast, int periodMedium, int periodSlow)
IchimokuCloud(IDataSeries inSeries, int periodFast, int periodMedium, int periodSlow)
//TenkanSen
IchimokuCloud(int periodFast, int periodMedium, int periodSlow).TenkanSen[int barsAgo]
IchimokuCloud(IDataSeries inSeries, int periodFast, int periodMedium, int periodSlow).TenkanSen[int barsAgo]
//KijunSen
IchimokuCloud(int periodFast, int periodMedium, int periodSlow).KijunSen[int barsAgo]
IchimokuCloud(IDataSeries inSeries, int periodFast, int periodMedium, int periodSlow).KijunSen[int barsAgo]
//ChikouSpan
IchimokuCloud(int periodFast, int periodMedium, int periodSlow).ChikouSpan[int barsAgo]
IchimokuCloud(IDataSeries inSeries, int periodFast, int periodMedium, int periodSlow).ChikouSpan[int barsAgo]
//SenkouSpanA
IchimokuCloud(int periodFast, int periodMedium, int periodSlow).SenkouSpanA[int barsAgo]
IchimokuCloud(IDataSeries inSeries, int periodFast, int periodMedium, int periodSlow).SenkouSpanA[int barsAgo]
//SenkouSpanB
IchimokuCloud(int periodFast, int periodMedium, int periodSlow).SenkouSpanB[int barsAgo]
IchimokuCloud(IDataSeries inSeries, int periodFast, int periodMedium, int periodSlow).SenkouSpanB[int barsAgo]
```
#### Return value
**double**
When using this method with an index (e.g. **IchimokuCloud**(9,26,52)\[**int** barsAgo] ), the value of the indicator will be issued for the referenced bar.
#### Parameters
inSeries Input data series for the indicator
periodFast Period setting for the Tenkan line. Default: 9
periodMedium Period setting for the Kijun line. Default: 29
periodSlow Number of periods used for the calculation of the Chikou line. Default: 52
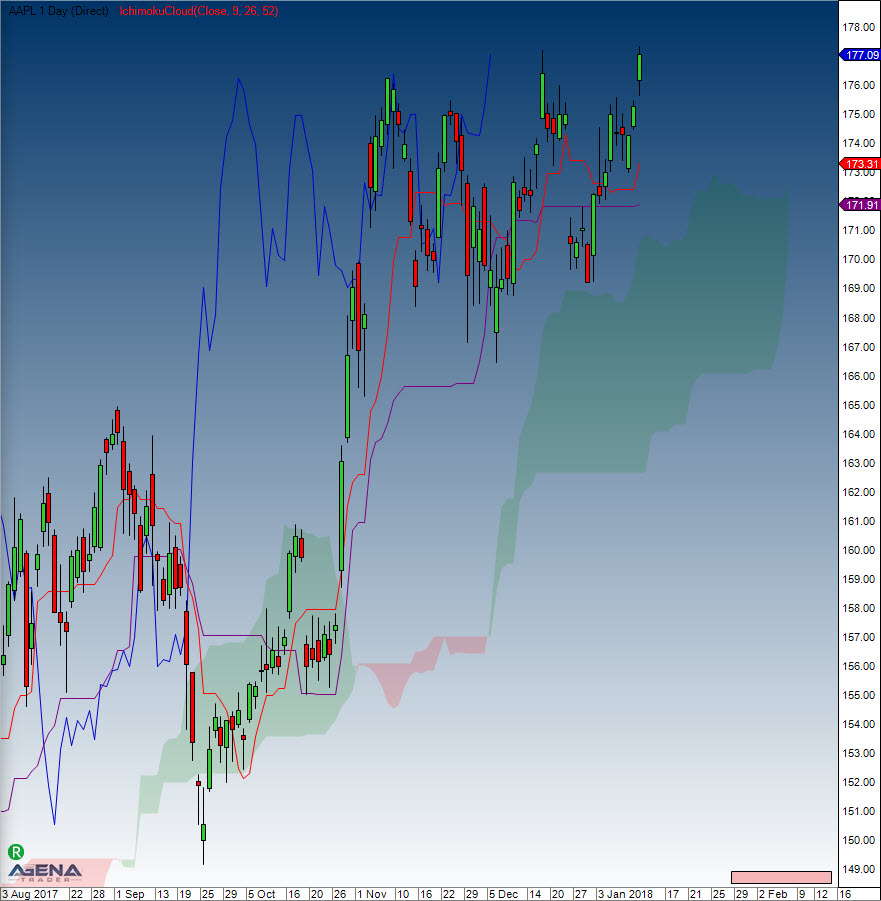
#### Visualization