Indicators
HomeIndicatorsAgenaScriptRelease Notes
  • 📒AgenaTrader Indicators Introduction
  • STANDARD INDICATORS
    • Accumulation/Distribution (ADL)
    • Adaptive Price Zone (APZ)
    • Aroon
    • Aroon Oscillator
    • Average Directional Index (ADX)
    • Average Directional Movement Rating (ADXR)
    • Average True Range (ATR)
    • BBBreakOutSpeed
    • Balance of Power (BOP)
    • Bollinger Bands
    • Bollinger Percent B (%b)
    • Bollinger Band Width (BBWidth)
    • Bollinger MTF (MultiTimeFrame)
    • BuySellPressure
    • BuySellVolume
    • CandleStickPattern
    • ChaikinMoneyFlow (CMF)
    • Chaikin Oscillator
    • ChaikinVolatility (CVL)
    • Chande Momentum Oscillator (CMO)
    • Climactic Distance
    • Commodity Channel Index (CCI)
    • Directional Movement (DM)
    • Donchian Channel
    • Directional Movement Index (DMI)
    • Double Stochastics (DSS)
    • Dynamic Momentum Index (DMIndex)
    • Ease of Movement (EOM)
    • Fisher Transform
    • Forecast Oscillator (FOSC)
    • HighestHighIndex()
    • HighestHighPrice()
    • IchimokuCloud
    • Keltner Channel
    • KeyReversalUp
    • KeyReversalDown
    • KeyReversalUpAtSMA
    • KeyReversalDownAtSMA
    • KeyReversalUpAtEMA
    • KeyReversalDownAtEMA
    • Linear Regression
    • LinRegIntercept
    • LinRegSlope
    • LowestLowIndex()
    • LowestLowPrice()
    • MACD
    • MAEnvelopes
    • Momentum (MOM)
    • Money Flow Index (MFI)
    • Moving Averages
      • DEMA - Double Exponential Moving Average
      • EMA - Exponential Moving Average
      • EMA MTF (MultiTimeFrame)
      • HMA - Hull Moving Average
      • KAMA - Kaufman's Adaptive Moving Average
      • MAMA - Mesa Adaptive Moving Average
      • SMA - Simple Moving Average
      • GapSMA - Gap Simple Moving Average
      • SMA MTF (MultiTimeFrame)
      • SMMA - Smoothed Moving Average
      • TEMA - Triple Exponential Moving Average
      • TMA - Triangular Moving Average
      • TRIX - Triple Exponential Moving Average
      • T3 - Triple Exponential Moving Average
      • VMA - Variable Moving Average
      • VWMA - Volume Weighted Moving Average
      • WMA - Weighted Moving Average
      • ZLEMA - Zero Lag Exponential Moving Average
    • nBarsUp
    • nBarsDown
    • OnBalanceVolume (OBV)
    • OutsideBars
    • Parabolic SAR
    • Percentage Price Oscillator (PPO)
    • PercentEnvelopes
    • Pivot Points
    • Polarized Fractal Efficiency (PFE)
    • Price Oscillator
    • Rainbow
    • Range
    • Range Indicator (RIND)
    • Rate of Change (ROC)
    • Relative Performance
    • Relative Spread Strength (RSS)
    • Relative Strength Index (RSI)
    • Relative Strength Levy (RSL)
    • Relative Volatility Index (RVI)
    • R-Squared
    • Standard Error (StdError)
    • Stochastics
    • Stochastics Fast
    • Stochastics RSI (StochRSI)
    • Summation (SUM)
    • SuperTrend
    • SupportResistanceAreas
    • Swing
    • Time-Series-Forecast (TSF)
    • Constant Lines
    • CurrentDayOHL
    • Daily Performance
    • DailyQuoteMoves
    • DayLines
    • GetDayBar
    • Info
    • Maximum (MAX)
    • Minimum (MIN)
    • PriceLine
    • PriorDayOHLC
    • PriorDayOHLCext
    • SessionBreakLines
    • ShowBidAsk
    • TickCounter
    • True Strength Index (TSI)
    • Ultimate Oscillator
    • Volume (VOL)
    • Volume Moving Average (VOLMA)
    • Volume Profile
    • Volume Rate of Change (VROC)
    • VolumeUpDown
    • Williams %R
    • ZigZag
  • PREMIUM INDICATORS
    • COT AddOn
      • COTLargeTraderActivity
      • COTStockDummy
      • COTReportLegacy
      • COTReportDisaggregated
      • COTOpenInterestLegacy
      • COTOpenInterestDisaggregated
      • COTCommercialIndex
      • COTAggregatedIndexPositionDisaggregated
    • DowTheory AddOn
      • DayLinesAdv
      • InsideBarsMT
      • MarketPhases
      • MarketPhases Pro
      • MTFBoxes
      • OutsideBars
      • P123
      • P123Pro
      • ReversalBars
    • Darvas AddOn
      • Darvas Boxes
    • Relative Currency Strength (RCS)
    • Volume AddOn
      • KlingerVolumeOscillator
      • Volume Oscillator
      • VolumeArea
      • VolumeGraph
      • VolumeKeltnerChannels
      • VolumeRiseFall
      • VolumeSentimentLong
      • VolumeSentimentShort
      • VolumeSessionPro
      • VolumeTickSpeed
      • VolumeUDR
      • Volume Zones
      • VolumeZoneOscillator
      • WyckoffWave
Powered by GitBook
On this page
Edit on GitLab
  1. STANDARD INDICATORS

Double Stochastics (DSS)

Description

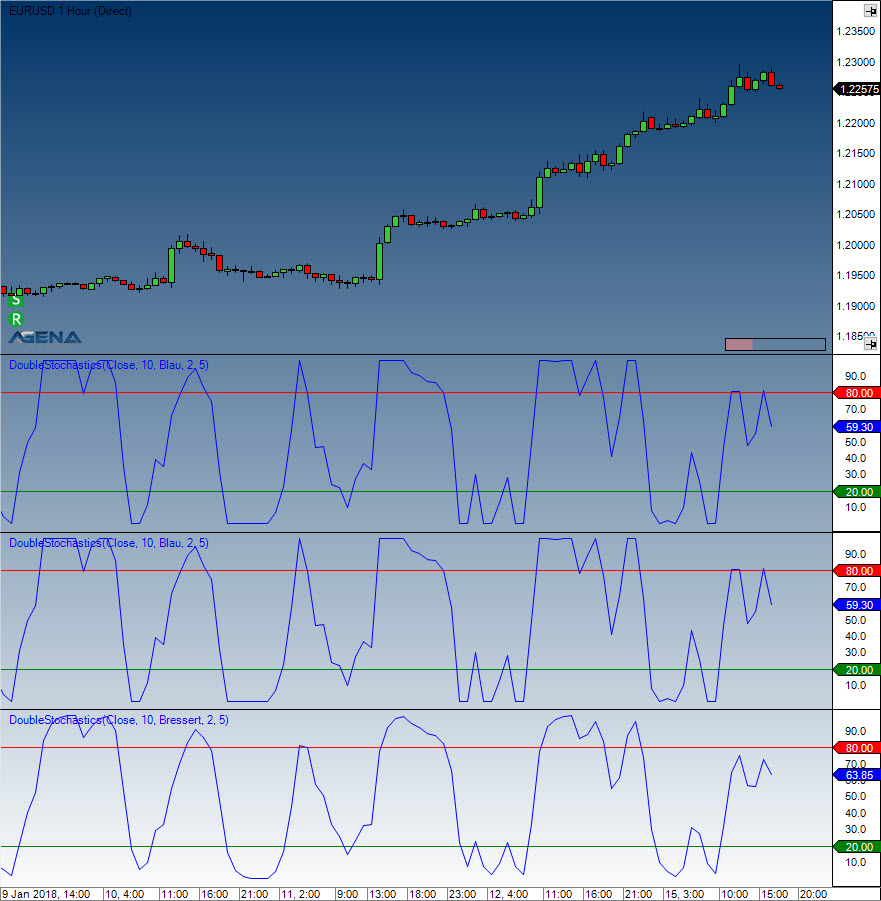
William Blau was the developer of the Double Smoothed Stochastic (DSS), which is a double-smoothed stochastic indicator. After a while, it was improved upon by Walter Bressert as a variation of the double-smoothed stochastic. Smaller changes in the price movements cause this indicator to react more sensitively, and it also produces more signals than the one Blau developed. The Bressert version therefore also illustrates extreme zones more clearly than the Blau version.

Regardless of the various calculation methods used, the DSS always stays within a scale of 0 to 100. The extreme zones in the developed stochastics are the same as for the original stochastics. The upper extreme area is marked at 80, and the lower extreme zone at 20 - these values cannot be changed. For many applications, it is wise to include an additional middle line at 50, and to adapt this to the circumstances as needed.

Interpretation

Values above 80 are seen as overbought, and below 20 as oversold. In addition, signals are produced by the signal line’s behavior and movements into and out of the extreme zones.

Usage

DoubleStochastics(int period)
DoubleStochastics(int period)[int barsAgo]
DoubleStochastics(int period, DoubleStochasticsMode mode, int EMA-Period1)
DoubleStochastics(IDataSeries inSeries, int period, DoubleStochasticsMode mode, int EMA-Period1)
DoubleStochastics(int period, DoubleStochasticsMode mode, int EMA-Period1)[int barsAgo]
DoubleStochastics(IDataSeries inSeries, int period, DoubleStochasticsMode mode, int EMA-Period1)[int barsAgo]
DoubleStochastics(int period, DoubleStochasticsMode mode, int EMA-Period1, int EMA-Period2)
DoubleStochastics(IDataSeries inSeries, int period, DoubleStochasticsMode mode, int EMA-Period1, int EMA-Period2)
DoubleStochastics(int period, DoubleStochasticsMode mode, int EMA-Period1, int EMA-Period2)[int barsAgo]
DoubleStochastics(IDataSeries inSeries, int period, DoubleStochasticsMode mode, int EMA-Period1, int EMA-Period2)[int barsAgo]

//For the value of %K
DoubleStochastics(int period).K[int barsAgo]
DoubleStochastics(IDataSeries inSeries, int period).K[int barsAgo]
DoubleStochastics(int period, DoubleStochasticsMode mode, int EMA-Period1).K[int barsAgo]
DoubleStochastics(IDataSeries inSeries, int period, DoubleStochasticsMode mode, int EMA-Period1).K[int barsAgo]
DoubleStochastics(int period, DoubleStochasticsMode mode, int EMA-Period1, int EMA-Period2).K[int barsAgo]
DoubleStochastics(IDataSeries inSeries, int period, DoubleStochasticsMode mode, int EMA-Period1, int EMA-Period2).K[int barsAgo]

Return value

double

When using this method with an index (e.g. DoubleStochastics(...)[int barsAgo] or DoubleStochastics(...).K[int barsAgo]), the value of the indicator will be issued for the referenced bar.

Parameters

inSeries Input data series for the indicator

period Number of bars included in the calculations (default: 10)

mode Method of calculation, possible inSeries are Blau, Blau2, Bressert

EMA-Period1 Periods for the EMA

EMA-Period2 Periods for the second EMA

Visualization

Example

//Output for %K
Print("The value of the DSS Bressert %K is: " + DoubleStochastics(10, DoubleStochasticsMode.Bressert, 2)[0]);

Last updated 3 years ago

Double Stochastics (DSS)