> For the complete documentation index, see [llms.txt](https://indicators.agenatrader.com/llms.txt). Markdown versions of documentation pages are available by appending `.md` to page URLs; this page is available as [Markdown](https://indicators.agenatrader.com/standard-indicators/parabolic-sar.md).
# Parabolic SAR
#### Description
Welles Wilder came up with the Parabolic SAR, which denotes a price and time-based trading system. Wilder named this the "Parabolic Time/Price System." SAR signifies "stop and reverse," which is the name of the actual indicator used in his system, where **SAR trails price as the trend extends over time**. When prices are rising, the indicator is below them, and when prices are falling, it is above them. Therefore the indicator stops and reverses when the price trend reverses and breaks either above or below the indicator.
Wilder used his new book, New Concepts in Technical Trading Systems, to introduce the Parabolic Time/Price System in 1978. The book also discusses RSI, Average True Range, and the Directional Movement Concept (ADX). Although they were created before the computer age, Wilder's indicators function equally well today and have a high reputation.
SAR follows the price, and can be considered a trend-following indicator. If a downtrend reverses and starts up, SAR follows the prices just like a trailing stop. This stop continues to rise so long as the uptrend remains intact, which means that the SAR never decreases in an uptrend and is always protecting profits as prices move forwards. Once the price stops rising and reverses below SAR, a downtrend starts and SAR is above the price. SAR follows prices lower like a trailing stop, as mentioned before. The stop continuously falls as long as the downtrend continues to exist. Due to the fact that SAR never rises in a downtrend, it always protects profits on short positions.
#### Further information
VTAD:
Wikipedia:
#### Usage
```csharp
ParabolicSAR(double acceleration, double accelerationStep, double accelerationMax)
ParabolicSAR(IDataSeries inSeries, double acceleration, double accelerationStep, double accelerationMax)
ParabolicSAR(double acceleration, double accelerationStep, double accelerationMax)[int barsAgo]
ParabolicSAR(IDataSeries inSeries, double acceleration, double accelerationStep, double accelerationMax)[int barsAgo]
```
#### Return value
**double**
When using this method with an index (e.g. **ParabolicSAR**(...)\[**int** barsAgo] ), the value of the indicator will be issued for the referenced bar.
#### Parameters
| | |
| ---------------- | ----------------------------------- |
| acceleration | Acceleration |
| accelerationStep | Increment of the acceleration |
| accelerationMax | Maximum acceleration |
| InSeries | Input data series for the indicator |
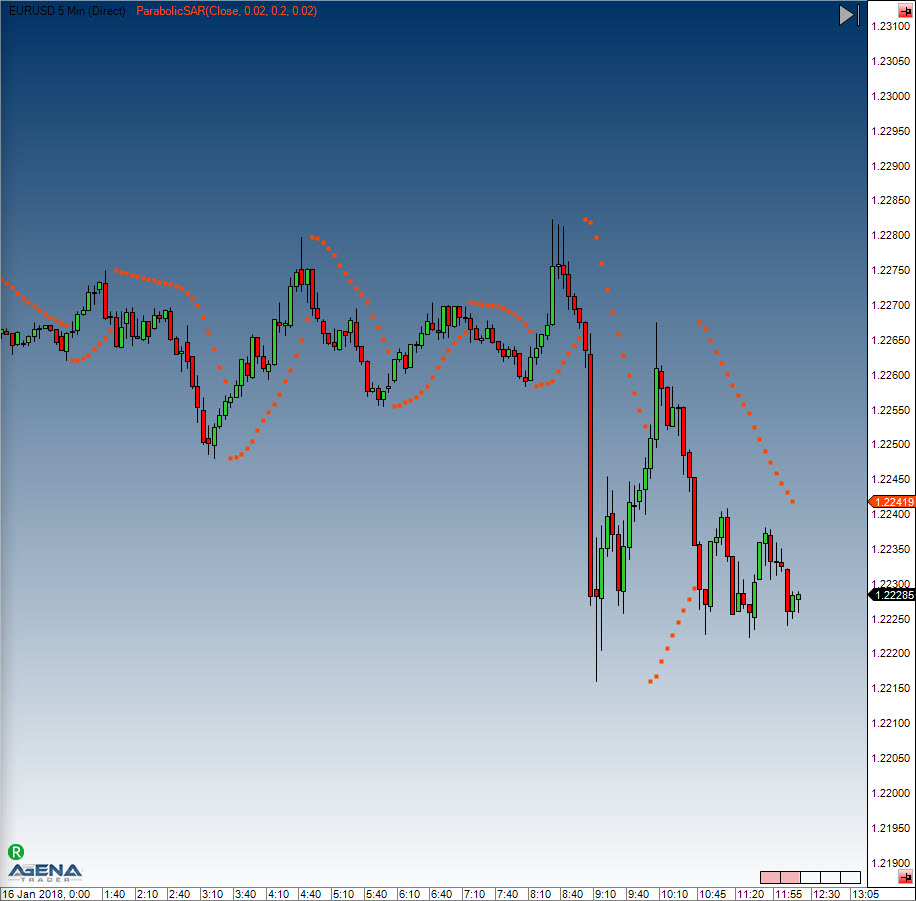
#### Visualization
#### Example
```csharp
//Output of the value for the PSAR
Print("The current value for the Parabolic SAR is " + ParabolicSAR(0.02, 0.2, 0.02)[0]);
```