> For the complete documentation index, see [llms.txt](https://indicators.agenatrader.com/llms.txt). Markdown versions of documentation pages are available by appending `.md` to page URLs; this page is available as [Markdown](https://indicators.agenatrader.com/standard-indicators/zigzag.md).
# ZigZag
#### Description
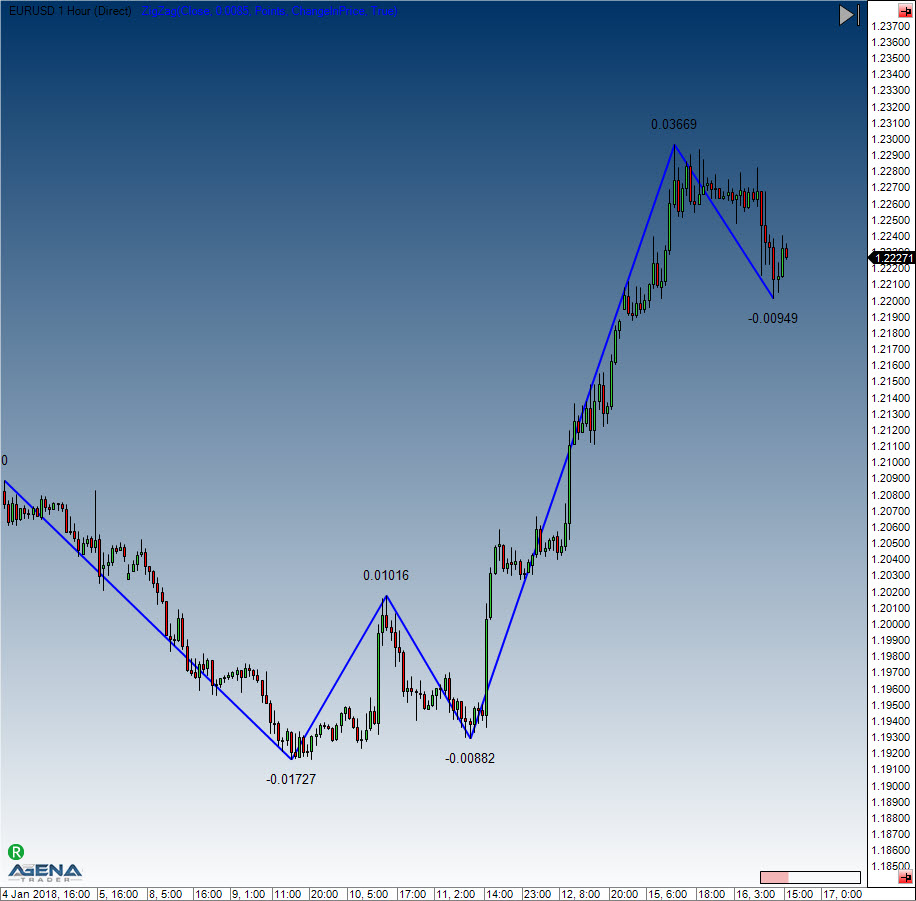
The ZigZag indicator searched for extreme points in different timeframes. It finds the extreme points by using threshold values that traders themselves define. These specified threshold values determine the extent to which the market direction needs to change before the ZigZag line alters its orientation and forms a further extreme point.
#### Interpretation
The previous extreme values (local highs or lows) are ideally suited for either entries or stop targets.
**Caution:** The ZigZag is not an indicator in the common sense. Position and direction of the zigzag can change retrospectively (repainting indicator).
#### Further information
#### Usage
```csharp
//For the upper extreme value
ZigZag(DeviationType deviationType, double deviationValue, bool useHighLow).ZigZagHigh[int barsAgo]
ZigZag(IDataSeries inSeries, DeviationType deviationType, double deviationValue, bool useHighLow).ZigZagHigh[int barsAgo]
//For the lower extreme value
ZigZag(DeviationType deviationType, double deviationValue, bool useHighLow).ZigZagLow[int barsAgo]
ZigZag(IDataSeries inSeries, DeviationType deviationType, double deviationValue, bool useHighLow).ZigZagLow[int barsAgo]
```
#### Return value
**double**
When using this method with an index (e.g. **ZigZag**(...)\[**int** barsAgo] ), the value of the indicator will be issued for the referenced bar.
A return value of 0 indicates that no high or low point has been found yet.
#### Parameters
| | |
| ---------------------------------------------- | ------------------------------------------------------------------------------------------------------------------ |
| inSeries | Input data series for the indicator |
| deviationType | The change in points or percent |
| DeviationType.Points and DeviationType.Percent | |
| deviationValue | Value of the deviation |
| useHighLow | Defines whether the high/low of a bar will be used for extreme values or if you want to use closing prices instead |
#### Visualization
#### Example
```csharp
//Output of the market value for the last high point
Print("The last high of the ZigZag indicator was at " + ZigZag(DeviationType.Percent, 1, true).ZigZagHigh[0]);
// Output of the market value for the last low point
Print("The last low of the ZigZag indicator was at " + ZigZag(DeviationType.Percent, 1, true).ZigZagLow[0]);
```
[ Previous](https://agenatrader.github.io/AgenaIndicator-documentation/data/)