> For the complete documentation index, see [llms.txt](https://indicators.agenatrader.com/llms.txt). Markdown versions of documentation pages are available by appending `.md` to page URLs; this page is available as [Markdown](https://indicators.agenatrader.com/standard-indicators/chaikinvolatility-cvl.md).
# ChaikinVolatility (CVL)
#### Description
The Chaikin Volatility Indicator is one of a few indicators that are designed to try and measure price movement fluctuations. Chaikin takes the daily price range (daily high minus daily low) as the fundamental measure of volatility. With this indicator, a widening range is, by implication, associated with a higher volatility.
#### Interpretation
The indicator oscillates around the zero line and fluctuates between a scale of +100 to -100. It can be used on a daily chart as well as on a weekly or monthly chart. All values above the zero line represent rising volatility, and the gradient of the rise implies the seriousness of potential floors forming. The Chaikin Volatility is not specifically used to define exact signals, but is considered as more of an assisting tool in the trading system.
#### Usage
```csharp
ChaikinVolatility(int fast, int slow)
ChaikinVolatility(IDataSeries inSeries, int fast, int slow)
ChaikinVolatility(int fast, int slow)[int barsAgo]
ChaikinVolatility(IDataSeries inSeries, int fast, int slow)[int barsAgo]
```
#### Return value
**double**
When using this method with an index (e.g. **ChaikinVolatility**(14)\[**int** barsAgo] ), the value of the indicator will be outputted for the referenced bar.
#### Parameters
inSeries Input data series for the indicator
period Number of bars included in the calculations
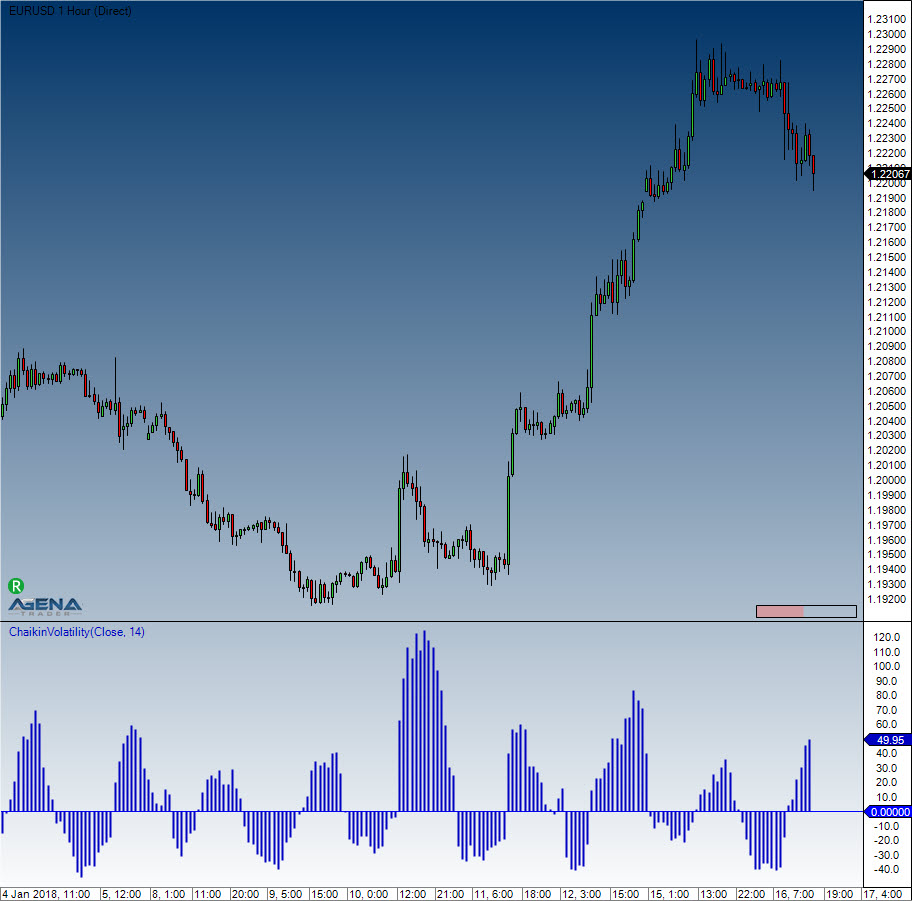
#### Visualization
#### Example
```csharp
//Chaikin output for a period of 14
Print("The value of the Chaikin Volatility is: " + ChaikinVolatility(14)[0]);
```