Indicators
HomeIndicatorsAgenaScriptRelease Notes
  • đź“’AgenaTrader Indicators Introduction
  • STANDARD INDICATORS
    • Accumulation/Distribution (ADL)
    • Adaptive Price Zone (APZ)
    • Aroon
    • Aroon Oscillator
    • Average Directional Index (ADX)
    • Average Directional Movement Rating (ADXR)
    • Average True Range (ATR)
    • BBBreakOutSpeed
    • Balance of Power (BOP)
    • Bollinger Bands
    • Bollinger Percent B (%b)
    • Bollinger Band Width (BBWidth)
    • Bollinger MTF (MultiTimeFrame)
    • BuySellPressure
    • BuySellVolume
    • CandleStickPattern
    • ChaikinMoneyFlow (CMF)
    • Chaikin Oscillator
    • ChaikinVolatility (CVL)
    • Chande Momentum Oscillator (CMO)
    • Climactic Distance
    • Commodity Channel Index (CCI)
    • Directional Movement (DM)
    • Donchian Channel
    • Directional Movement Index (DMI)
    • Double Stochastics (DSS)
    • Dynamic Momentum Index (DMIndex)
    • Ease of Movement (EOM)
    • Fisher Transform
    • Forecast Oscillator (FOSC)
    • HighestHighIndex()
    • HighestHighPrice()
    • IchimokuCloud
    • Keltner Channel
    • KeyReversalUp
    • KeyReversalDown
    • KeyReversalUpAtSMA
    • KeyReversalDownAtSMA
    • KeyReversalUpAtEMA
    • KeyReversalDownAtEMA
    • Linear Regression
    • LinRegIntercept
    • LinRegSlope
    • LowestLowIndex()
    • LowestLowPrice()
    • MACD
    • MAEnvelopes
    • Momentum (MOM)
    • Money Flow Index (MFI)
    • Moving Averages
      • DEMA - Double Exponential Moving Average
      • EMA - Exponential Moving Average
      • EMA MTF (MultiTimeFrame)
      • HMA - Hull Moving Average
      • KAMA - Kaufman's Adaptive Moving Average
      • MAMA - Mesa Adaptive Moving Average
      • SMA - Simple Moving Average
      • GapSMA - Gap Simple Moving Average
      • SMA MTF (MultiTimeFrame)
      • SMMA - Smoothed Moving Average
      • TEMA - Triple Exponential Moving Average
      • TMA - Triangular Moving Average
      • TRIX - Triple Exponential Moving Average
      • T3 - Triple Exponential Moving Average
      • VMA - Variable Moving Average
      • VWMA - Volume Weighted Moving Average
      • WMA - Weighted Moving Average
      • ZLEMA - Zero Lag Exponential Moving Average
    • nBarsUp
    • nBarsDown
    • OnBalanceVolume (OBV)
    • OutsideBars
    • Parabolic SAR
    • Percentage Price Oscillator (PPO)
    • PercentEnvelopes
    • Pivot Points
    • Polarized Fractal Efficiency (PFE)
    • Price Oscillator
    • Rainbow
    • Range
    • Range Indicator (RIND)
    • Rate of Change (ROC)
    • Relative Performance
    • Relative Spread Strength (RSS)
    • Relative Strength Index (RSI)
    • Relative Strength Levy (RSL)
    • Relative Volatility Index (RVI)
    • R-Squared
    • Standard Error (StdError)
    • Stochastics
    • Stochastics Fast
    • Stochastics RSI (StochRSI)
    • Summation (SUM)
    • SuperTrend
    • SupportResistanceAreas
    • Swing
    • Time-Series-Forecast (TSF)
    • Constant Lines
    • CurrentDayOHL
    • Daily Performance
    • DailyQuoteMoves
    • DayLines
    • GetDayBar
    • Info
    • Maximum (MAX)
    • Minimum (MIN)
    • PriceLine
    • PriorDayOHLC
    • PriorDayOHLCext
    • SessionBreakLines
    • ShowBidAsk
    • TickCounter
    • True Strength Index (TSI)
    • Ultimate Oscillator
    • Volume (VOL)
    • Volume Moving Average (VOLMA)
    • Volume Profile
    • Volume Rate of Change (VROC)
    • VolumeUpDown
    • Williams %R
    • ZigZag
  • PREMIUM INDICATORS
    • COT AddOn
      • COTLargeTraderActivity
      • COTStockDummy
      • COTReportLegacy
      • COTReportDisaggregated
      • COTOpenInterestLegacy
      • COTOpenInterestDisaggregated
      • COTCommercialIndex
      • COTAggregatedIndexPositionDisaggregated
    • DowTheory AddOn
      • DayLinesAdv
      • InsideBarsMT
      • MarketPhases
      • MarketPhases Pro
      • MTFBoxes
      • OutsideBars
      • P123
      • P123Pro
      • ReversalBars
    • Darvas AddOn
      • Darvas Boxes
    • Relative Currency Strength (RCS)
    • Volume AddOn
      • KlingerVolumeOscillator
      • Volume Oscillator
      • VolumeArea
      • VolumeGraph
      • VolumeKeltnerChannels
      • VolumeRiseFall
      • VolumeSentimentLong
      • VolumeSentimentShort
      • VolumeSessionPro
      • VolumeTickSpeed
      • VolumeUDR
      • Volume Zones
      • VolumeZoneOscillator
      • WyckoffWave
Powered by GitBook
On this page
Edit on GitLab
  1. STANDARD INDICATORS

Aroon

Last updated 3 years ago

Description

Aroon, an indicator system that determines whether or not a stock is trending and how strong this trend is, was developed by Tushar Chande in 1995. Its name is derived from the Sanskrit “dawn’s early light”. Chande used this name to signify the indicators’ purpose of revealing the start of a new trend. These indicators measure the number of periods since the last time the price recorded an x-day high or low. There are two distinct indicators: the Aroon-Up and Aroon-Down, whereby a 50-day Aroon-Up measures the number of days since a 50-day high, and a 50-day Aroon-Down measures the days since a 50-day low. This makes the Aroon indicators significantly different from the usual momentum oscillators, which concentrate on price in relation to time. What makes Aroon indicators unique is that they focus on time in relation to price. Aroon indicators can be used to detect emerging trends, identify consolidations, anticipate reversals and define correction periods.

Interpretation

The Aroon indicators fluctuate above/below a centerline (50) and are bound between 0 and 100. These three levels are important for interpretation. At its most basic, the bulls have the edge when Aroon-Up is above 50 and Aroon-Down is below 50. This indicates a greater propensity for new x-day highs than lows. The converse is true for a downtrend. The bears have the edge when Aroon-Up is below 50 and Aroon-Down is above 50.

A surge to 100 indicates that a trend may be emerging. This can be confirmed with a decline in the other Aroon indicator. For example, a move to 100 in Aroon-Up combined with a decline below 30 in Aroon-Down shows upside strength. Consistently high readings mean prices are regularly hitting new highs or new lows for the specified period. Prices are moving consistently higher when Aroon-Up remains in the 70-100 range for an extended period. Conversely, consistently low readings indicate that prices are seldom hitting new highs or lows. Prices are NOT moving lower when Aroon-Down remains in the 0-30 range for an extended period. This does not mean prices are moving higher though. For that we need to check Aroon-Up.

Further information

Usage

Aroon(int period)
Aroon(IDataSeries inSeries, int period)
//For the upper value
Aroon(int period).Up[int barsAgo]
Aroon(IDataSeries inSeries, int period).Up[int barsAgo]
//For the lower value
Aroon(int period).Down[int barsAgo]
Aroon(IDataSeries inSeries, int period).Down[int barsAgo]

Return value

double

When using this method with an index (e.g. Aroon(20)[int barsAgo] ) the value of the indicator will be displayed for the last referenced bar.

Parameters

inSeries Input data series for the indicator

period Number of bars taken into consideration when calculating the values
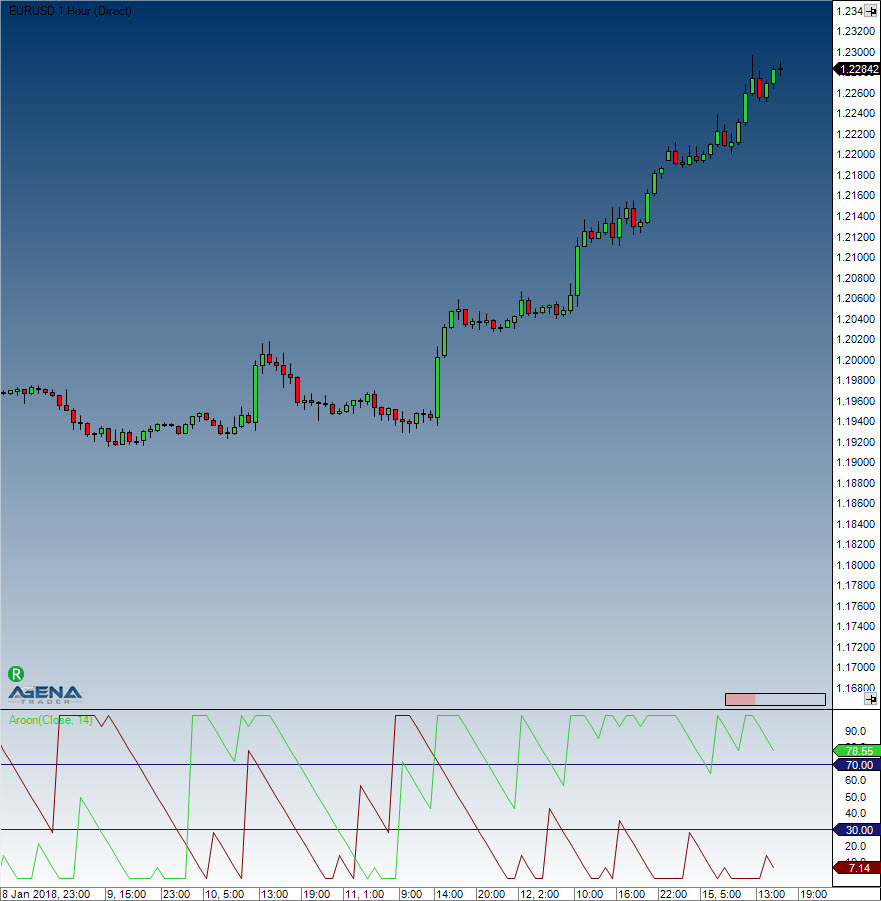
Visualization

Example

//Output of the current up or down values for the 20 period Aroon
Print("Current value for Aroon Up is : " + Aroon(20).Up[0]);
Print("Current value for Aroon Down is: " + Aroon(20).Down[0]);
Aroon
http://stockcharts.com/school/doku.php?id=chart_school:technical_indicators:aroon