> For the complete documentation index, see [llms.txt](https://indicators.agenatrader.com/llms.txt). Markdown versions of documentation pages are available by appending `.md` to page URLs; this page is available as [Markdown](https://indicators.agenatrader.com/premium-indicators/dowtheory-addon/mtfboxes.md).
# MTFBoxes
#### Description
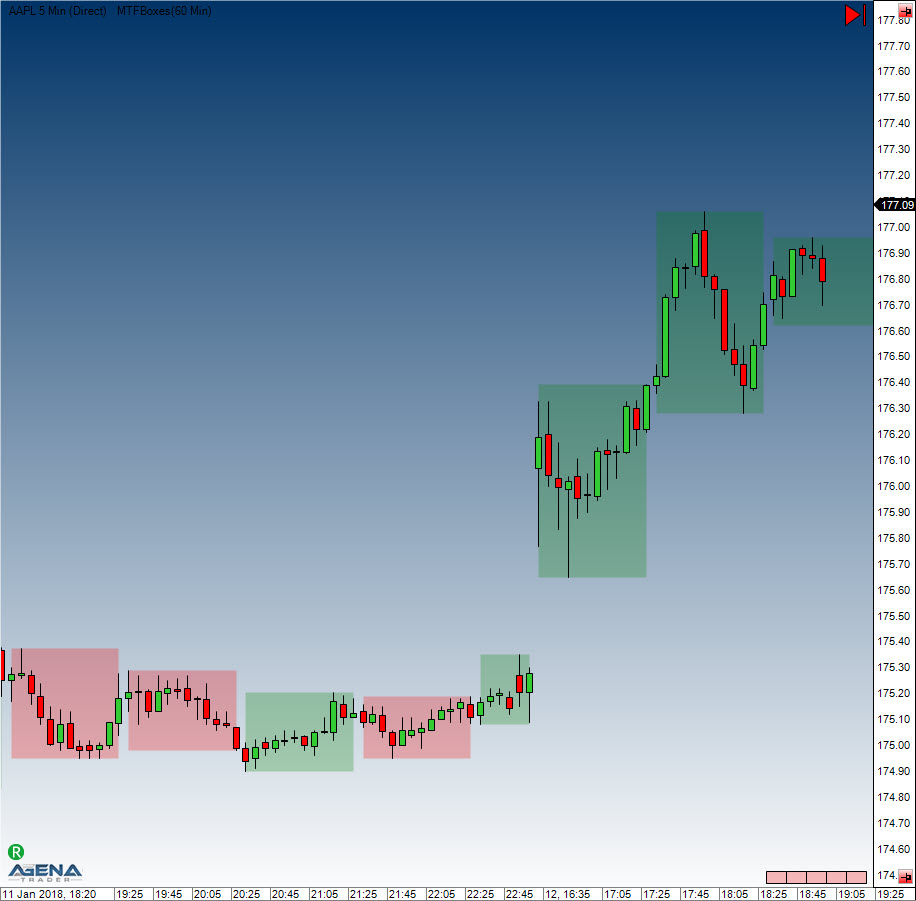
What MTFBoxes does is to draw a colored area behind the bars that signify a candle from a higher timeframe. This therefore makes it possible to depict an hourly candle inside a 5-minute chart. The area would contain all 5-minute bars that are located within said hourly candle.
The area turns greener if the candle of the higher timeframe is rising. A Doji would be shown in grey.
#### Parameters
TimeFrame Timeframe of the “virtual” candle (second, minute, hour, day, week, month) TimeFrameValue Value of the timeframe (number)
#### Visualization