> For the complete documentation index, see [llms.txt](https://indicators.agenatrader.com/llms.txt). Markdown versions of documentation pages are available by appending `.md` to page URLs; this page is available as [Markdown](https://indicators.agenatrader.com/standard-indicators/bollinger-percent-b-b.md).
# Bollinger Percent B (%b)
#### Description
Bollinger %b is an important indicator that is derived from John Bollinger's original Bollinger Bands indicator. %b represents the location of the most recent close price in relation to the Bollinger Bands as well as to what degree it is above or below any of the bands. The Bollinger Percent B equation can be constructed in the following way: Percent B = ((Close - Bollinger Lower Band) / (Bollinger Upper Band - Bollinger Lower Band)) \* 100. If the close price is the same as the upper Bollinger Band, %b will be 100 (percent). If the close price is the same as the lower Bollinger Band, %b will be 0.0 (percent). A %b value of 50 indicates that the close price is equal to the middle Bollinger Band. What is more, readings above 100 and below 0 show that the close price is outside of the Bollinger Bands by a corresponding percentage of the Bollinger Bandwidth. A %b value of 125 means that the close price is above the upper Bollinger Band by 25% of the Bandwidth, while a %b value of -25 means that the close price is below the lower Bollinger Band by 25% of the Bandwidth.
See [*Bollinger Bands*](/standard-indicators/bollinger-bands.md), [*BBWidth*](/standard-indicators/bollinger-band-width-bbwidth.md)
**An additional application: normalizing indicators**
Bollinger bands, and therefore the %b indicator, can be applied not only to the prices of stocks, futures etc., but also to time series with fundamental data, volume data and other indicators. This is particularly interesting when you need to know whether a value is relatively high or low – in this case, the %b indicator offers you a different perspective. If you wish to find out whether the volume of a stock is exceedingly high or low, you can simply apply it to the volume data. John Bollinger regards the application of the %b onto other indicators as one of the most important aspects of the indicator. If you wish to normalize an indicator with %b, it is important to first calculate the indicator (e.g. the RSI) with the help of the %b for the calculation of the indicator instead of the price data. The application of the %b essentially works in the same way as the application of Bollinger bands onto the indicator itself. The intersection points between the bands and the indicators will therefore be 1 and 0. In principle, the relative position of the original indicator is displayed in relation to its upper and lower bands. This means that the boundaries of the original indicator will be removed. John Bollinger himself wrote: “You’re defining a high or low point on a relative basis, this may allow you to gain a deeper insight and understanding not provided by traditional indicators and guidelines.” John Bollinger provides several parameters for the %b calculation, such as 40-day periods and a factor of 2.0 for a 9-day RSI, and a 50-day period with a factor of 2.1 for the calculation of %b.
(Sources: Oliver Paesler: "Technische Indikatoren - simplified" and John Bollinger: "Bollinger Bänder")
(Source: *tradesignalonline*)
#### Further information
VTAD:
Book "Technische Indikatoren - simplified" by Oliver Paesler (German only)
#### Usage
```csharp
BollingerPercentB(int period, double numStdDev)
BollingerPercentB(IDataSeries inSeries, int period, double numStdDev)
BollingerPercentB(int period, double numStdDev) [int barsAgo]
BollingerPercentB(IDataSeries inSeries, int period, double numStdDev)[int barsAgo]
```
#### Return value
**double**
When using this method with an index (e.g. **BollingerPercentB**(20, 2)\[**int** barsAgo] ), the value of the indicator will be outputted for the referenced bar.
#### Parameters
inSeries Input data series for the indicator
period Number of bars included in the calculation
numStdDev Standard deviation
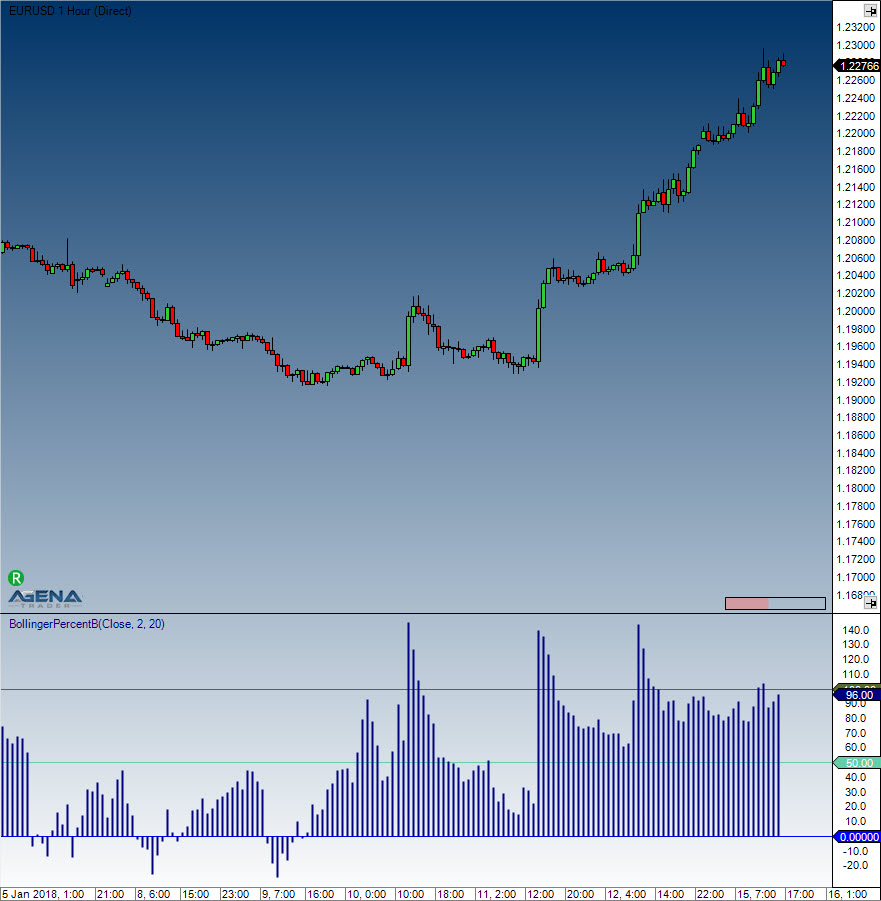
#### Visualization
#### Example
```csharp
//Output for the value of Bollinger %B
Print("Value of the Bollinger Percent B is: " + BollingerPercentB(20, 2)[0]);
```