Commodity Channel Index (CCI)
Description
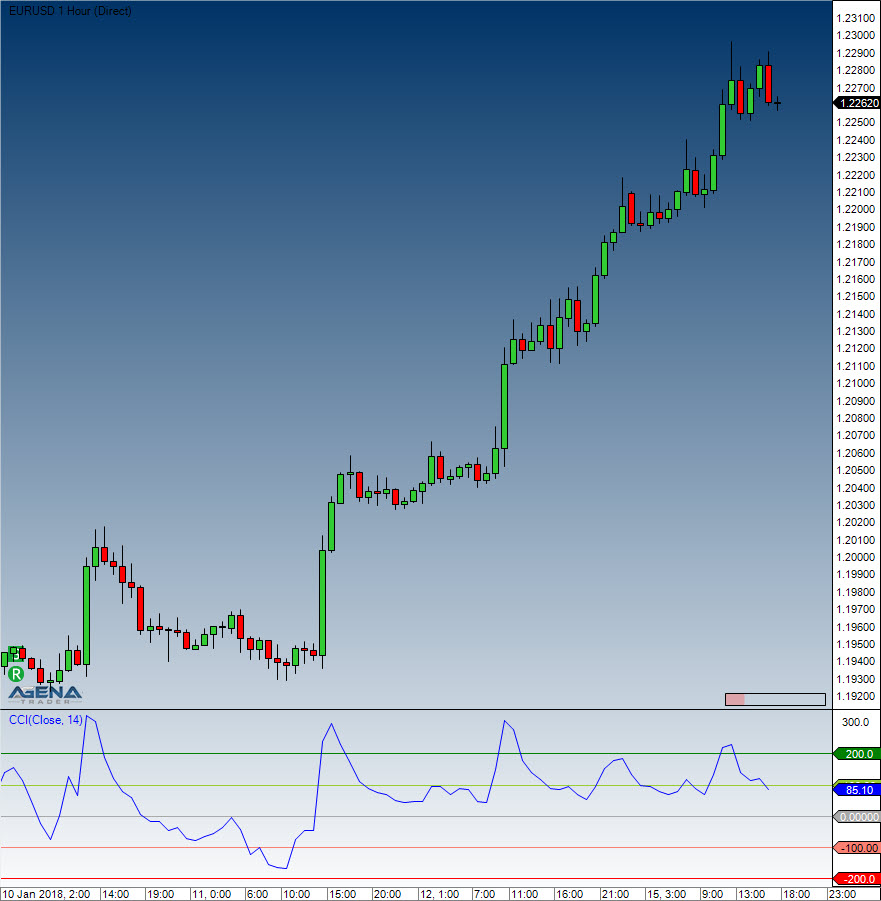
The Commodity Channel Index (CCI), which was created by Donald Lambert and actually featured in Commodities magazine in 1980, is a versatile indicator that can be used for identifying a new trend or as a warning of extreme conditions. Lambert originally developed the CCI as a means to identify cyclical turns in commodities – however, the indicator can also successfully be applied to ETFs, indices, stocks and various other securities. In general, what CCI does is to measure the current price level relative to an average price level over a specified period of time. When prices are well above their average, CCI is relatively high. When prices are far below their average, CCI is relatively low. This is how CCI can be used for identifying overbought and oversold levels.
Interpretation
CCI measures the difference between a securitys price change and its average price change. High positive readings indicate that prices are well above their average, which is a show of strength. Low negative readings indicate that prices are well below their average, which is a show of weakness.
The Commodity Channel Index (CCI) can be used as either a coincident or leading indicator. As a coincident indicator, surges above +100 reflect strong price action that can signal the start of an uptrend. Plunges below -100 reflect weak price action that can signal the start of a downtrend.
As a leading indicator, momentum oscillators, chartists can look for overbought or oversold conditions that may foreshadow a mean reversion. Similarly, bullish and bearish divergences can be used to detect early momentum shifts and anticipate trend reversals.
Further information
VTAD: http://vtadwiki.vtad.de/index.php/Commodity_Channel_Index
Usage
CCI(int period)
CCI(IDataSeries inSeries, int period)
CCI(int period)[int barsAgo]
CCI(IDataSeries inSeries, int period)[int barsAgo]Return value
double
When using this method with an index (e.g. CCI(14)[int barsAgo] ), the value of the indicator will be issued for the referenced bar.
Parameters
inSeries Input data series for the indicator
period Number of bars included in the calculations
Visualization

Example
Last updated