> For the complete documentation index, see [llms.txt](https://indicators.agenatrader.com/llms.txt). Markdown versions of documentation pages are available by appending `.md` to page URLs; this page is available as [Markdown](https://indicators.agenatrader.com/standard-indicators/williams-r.md).
# Williams %R
#### Description
Larry Williams developed the Williams %R. It is a momentum indicator, and is the inverse of the Fast Stochastic Oscillator. Williams %R, which is also called simply %R, reflects the level of the close relative to the highest high for the look-back period. The Stochastic Oscillator, on the other hand, reflects the level of the close relative to the lowest low. %R multiplies the raw value by -100 as a means of correcting for the inversion. This means that the Fast Stochastic Oscillator and Williams %R actually produce the exact same lines, with different scaling. The Williams %R fluctuates between 0 and -100. Values between 0 to -20 are deemed overbought, and values from -80 to -100 are seen as oversold. Naturally, signals taken from the Stochastic Oscillator can also be applied to Williams %R.
#### Interpretation
As with the Stochastic Oscillator, Williams %R reflects the level of the close relative to the high-low range over a given period of time. Assume that the highest high equals 110, the lowest low equals 100 and the close equals 108. The high-low range is 10 (110 - 100), which is the denominator in the %R formula. The highest high less the close equals 2 (110 - 108), which is the numerator. 2 divided by 10 equals 0.20. Multiply this number by -100 to get -20 for %R. Williams %R would equal -30 if the close was 103 (0.30 x -100).
The centerline, -50, is an important level to watch. Williams %R moves between 0 and -100, which makes -50 the midpoint. Think of it as the 50 yard line in football. The offense has a higher chance of scoring when it crosses the 50 yard line. The defense has an edge as long as it prevents the offense from crossing the 50 yard line. A Williams %R cross above -50 signals that prices are trading in the upper half of their high-low range for the given look-back period. This suggests that the cup is half full. Conversely, a cross below -50 means prices are trading in the bottom half of the given look-back period. This suggests that the cup is half empty.
Low readings (below -80) indicate that the price is near its low for the given time period. High readings (above -20) indicate that the price is near its high for the given time period.
#### Further information
#### Usage
```
WilliamsR(int period)
WilliamsR(IDataSeries inSeries, int period)
WilliamsR(int period)[int barsAgo]
WilliamsR(IDataSeries inSeries, int period)[int barsAgo]
```
#### Return value
**double**
When using this method with an index (e.g. **WilliamsR**(14)\[**int** barsAgo] ), the value of the indicator will be issued for the referenced bar.
#### Parameters
inSeries Input data series for the indicator
period Number of bars included in the calculations
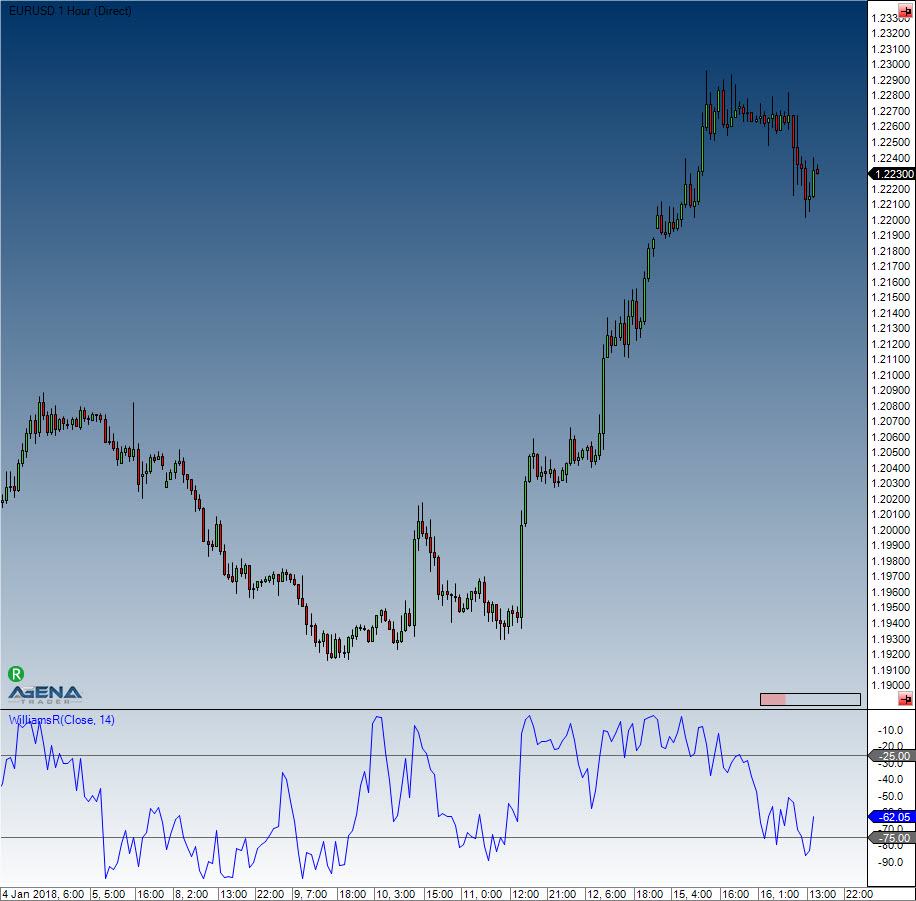
#### Visualization
#### Example
```csharp
WilliamsR(int period)
WilliamsR(IDataSeries inSeries, int period)
WilliamsR(int period)[int barsAgo]
WilliamsR(IDataSeries inSeries, int period)[int barsAgo]
```