> For the complete documentation index, see [llms.txt](https://indicators.agenatrader.com/llms.txt). Markdown versions of documentation pages are available by appending `.md` to page URLs; this page is available as [Markdown](https://indicators.agenatrader.com/standard-indicators/adaptive-price-zone-apz.md).
# Adaptive Price Zone (APZ)
#### Description
This is a technical indicator developed by Lee Leibfarth in 2006. The Adaptive Price Zone is a volatility-based indicator shown as a set of bands laid over a price chart. The APZ, which is particularly useful in non-trending, choppy markets, was developed with the aim of helping traders to find potential turning points in the markets. The APZ is based on a short-term, double-smoothed EMA that reacts rapidly to price changes with reduced lag. It works in the following way: the bands create a channel that envelopes the average price and tracks price changes. If the price crosses over the upper band of the zone, this creates an opportunity for the trader to trade a reversal. For the lower band, the reverse is true.
#### Interpretation
The bigger the price movement, the greater the distance between the upper and lower band will be. The smaller the price movement, the smaller the distance between the bands. More widely spaced bands will indicate increased instability and volatility, whereas closely tuned bands will display reduced volatility. If the price action breaks through the upper or lower band then the APZ will tend to return to its statistical average. This will lead to trading opportunities where the market may try to compensate for imbalances. If the price overshoots the bands for example, as mentioned in the description, then this will present you with a trading opportunity in the opposite direction.
#### Further information
#### Usage
```csharp
APZ(double barPct, int period)
APZ(IDataSeries inSeries, double barPct, int period)
//Upper Band
APZ(double barPct, int period).Upper[int barsAgo]
APZ(IDataSeries inSeries, double barPct, int period).Upper[int barsAgo]
//Lower Band
APZ(double barPct, int period).Lower[int barsAgo]
APZ(IDataSeries inSeries, double barPct, int period).Lower[int barsAgo]
```
#### Return value
**double**
When using the method with an index (e.g. **APZ**(2, 20)\[**int** barsAgo] ), the value of the indicator will be outputted for the referenced bar.
#### Parameters
barPct Standard deviation
inSeries Input data series for the indicator
period Number of bars included in the calculation
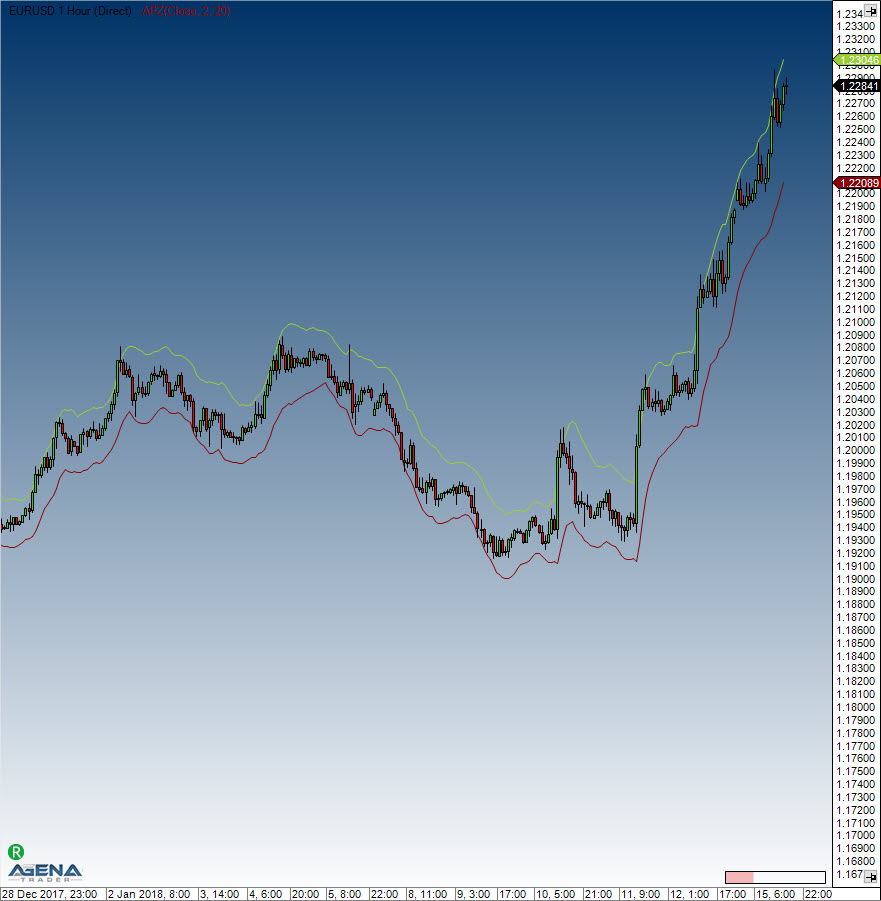
#### Visualization
#### Example
```csharp
//Output for the current values for the upper and lower band of a 20-period APZ
Print("Value for the upper APZ band : " + APZ(2, 20).Upper[0]);
Print("Value for the lower APZ band: " + APZ(2, 20).Lower[0]);
```