Indicators
HomeIndicatorsAgenaScriptRelease Notes
  • 📒AgenaTrader Indicators Introduction
  • STANDARD INDICATORS
    • Accumulation/Distribution (ADL)
    • Adaptive Price Zone (APZ)
    • Aroon
    • Aroon Oscillator
    • Average Directional Index (ADX)
    • Average Directional Movement Rating (ADXR)
    • Average True Range (ATR)
    • BBBreakOutSpeed
    • Balance of Power (BOP)
    • Bollinger Bands
    • Bollinger Percent B (%b)
    • Bollinger Band Width (BBWidth)
    • Bollinger MTF (MultiTimeFrame)
    • BuySellPressure
    • BuySellVolume
    • CandleStickPattern
    • ChaikinMoneyFlow (CMF)
    • Chaikin Oscillator
    • ChaikinVolatility (CVL)
    • Chande Momentum Oscillator (CMO)
    • Climactic Distance
    • Commodity Channel Index (CCI)
    • Directional Movement (DM)
    • Donchian Channel
    • Directional Movement Index (DMI)
    • Double Stochastics (DSS)
    • Dynamic Momentum Index (DMIndex)
    • Ease of Movement (EOM)
    • Fisher Transform
    • Forecast Oscillator (FOSC)
    • HighestHighIndex()
    • HighestHighPrice()
    • IchimokuCloud
    • Keltner Channel
    • KeyReversalUp
    • KeyReversalDown
    • KeyReversalUpAtSMA
    • KeyReversalDownAtSMA
    • KeyReversalUpAtEMA
    • KeyReversalDownAtEMA
    • Linear Regression
    • LinRegIntercept
    • LinRegSlope
    • LowestLowIndex()
    • LowestLowPrice()
    • MACD
    • MAEnvelopes
    • Momentum (MOM)
    • Money Flow Index (MFI)
    • Moving Averages
      • DEMA - Double Exponential Moving Average
      • EMA - Exponential Moving Average
      • EMA MTF (MultiTimeFrame)
      • HMA - Hull Moving Average
      • KAMA - Kaufman's Adaptive Moving Average
      • MAMA - Mesa Adaptive Moving Average
      • SMA - Simple Moving Average
      • GapSMA - Gap Simple Moving Average
      • SMA MTF (MultiTimeFrame)
      • SMMA - Smoothed Moving Average
      • TEMA - Triple Exponential Moving Average
      • TMA - Triangular Moving Average
      • TRIX - Triple Exponential Moving Average
      • T3 - Triple Exponential Moving Average
      • VMA - Variable Moving Average
      • VWMA - Volume Weighted Moving Average
      • WMA - Weighted Moving Average
      • ZLEMA - Zero Lag Exponential Moving Average
    • nBarsUp
    • nBarsDown
    • OnBalanceVolume (OBV)
    • OutsideBars
    • Parabolic SAR
    • Percentage Price Oscillator (PPO)
    • PercentEnvelopes
    • Pivot Points
    • Polarized Fractal Efficiency (PFE)
    • Price Oscillator
    • Rainbow
    • Range
    • Range Indicator (RIND)
    • Rate of Change (ROC)
    • Relative Performance
    • Relative Spread Strength (RSS)
    • Relative Strength Index (RSI)
    • Relative Strength Levy (RSL)
    • Relative Volatility Index (RVI)
    • R-Squared
    • Standard Error (StdError)
    • Stochastics
    • Stochastics Fast
    • Stochastics RSI (StochRSI)
    • Summation (SUM)
    • SuperTrend
    • SupportResistanceAreas
    • Swing
    • Time-Series-Forecast (TSF)
    • Constant Lines
    • CurrentDayOHL
    • Daily Performance
    • DailyQuoteMoves
    • DayLines
    • GetDayBar
    • Info
    • Maximum (MAX)
    • Minimum (MIN)
    • PriceLine
    • PriorDayOHLC
    • PriorDayOHLCext
    • SessionBreakLines
    • ShowBidAsk
    • TickCounter
    • True Strength Index (TSI)
    • Ultimate Oscillator
    • Volume (VOL)
    • Volume Moving Average (VOLMA)
    • Volume Profile
    • Volume Rate of Change (VROC)
    • VolumeUpDown
    • Williams %R
    • ZigZag
  • PREMIUM INDICATORS
    • COT AddOn
      • COTLargeTraderActivity
      • COTStockDummy
      • COTReportLegacy
      • COTReportDisaggregated
      • COTOpenInterestLegacy
      • COTOpenInterestDisaggregated
      • COTCommercialIndex
      • COTAggregatedIndexPositionDisaggregated
    • DowTheory AddOn
      • DayLinesAdv
      • InsideBarsMT
      • MarketPhases
      • MarketPhases Pro
      • MTFBoxes
      • OutsideBars
      • P123
      • P123Pro
      • ReversalBars
    • Darvas AddOn
      • Darvas Boxes
    • Relative Currency Strength (RCS)
    • Volume AddOn
      • KlingerVolumeOscillator
      • Volume Oscillator
      • VolumeArea
      • VolumeGraph
      • VolumeKeltnerChannels
      • VolumeRiseFall
      • VolumeSentimentLong
      • VolumeSentimentShort
      • VolumeSessionPro
      • VolumeTickSpeed
      • VolumeUDR
      • Volume Zones
      • VolumeZoneOscillator
      • WyckoffWave
Powered by GitBook
On this page
Edit on GitLab
  1. STANDARD INDICATORS

Relative Strength Levy (RSL)

Last updated 3 years ago

Description

The concept of the Relative Strength according to R.A. Levy is that the past developments play a very important role in the strength that will be seen in the future. The current performance is compared to the past performance.

The calculation involves taking the weekly closes (or daily closes) and dividing them by the arithmetic mean of the closing prices for the examined period. The result is then balanced around the 10 marker, and an ordered list is created where the value of the highest RSL fills the first place.

Usage

RSL(int period)
RSLDataSeries inSeries, int period)
RSLnt period)[int barsAgo]
RSL(IDataSeries inSeries, int period)[int barsAgo]

Return value

double

When using this method with an index (e.g. RSL(27)[int barsAgo] ), the value of the indicator will be issued for the referenced bar.

Parameters

inSeries Input data series for the indicator

period Number of bars included in the calculations
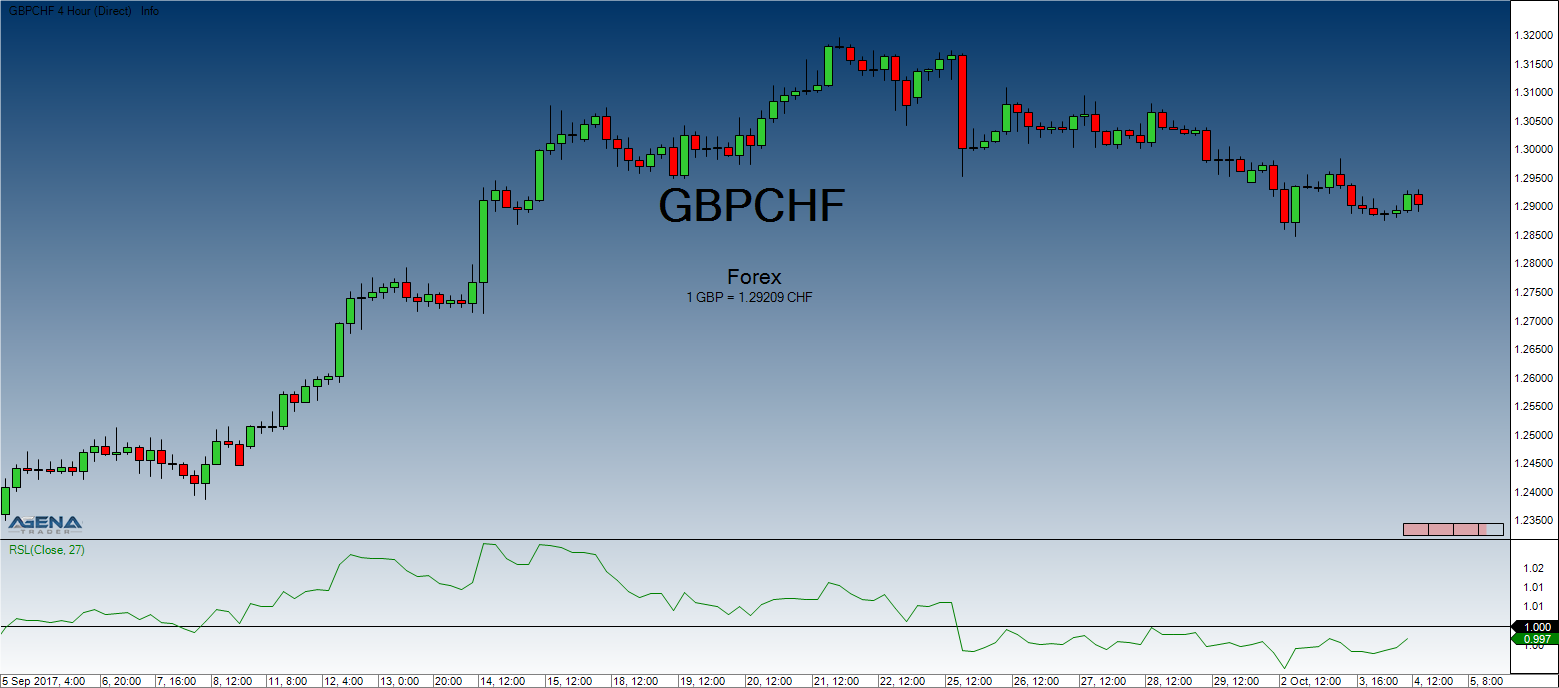
Visualization

Relative Strength Levy (RSL)

Example

//RSL value output
Print("The Relative Strength as calculated by Levy is " + RSL(27)[0]);