> For the complete documentation index, see [llms.txt](https://indicators.agenatrader.com/llms.txt). Markdown versions of documentation pages are available by appending `.md` to page URLs; this page is available as [Markdown](https://indicators.agenatrader.com/standard-indicators/ease-of-movement-eom.md).
# Ease of Movement (EOM)
#### Description
Ease of Movement (EMV) is a volume-based oscillator created by Richard Arms that constantly moves above and below the zero line. It is intended to measure the "ease" of price movement, as suggested by the name. Arms developed Equivolume charts in order to visually display price ranges and volume. Ease of Movement expands upon Equivolume by quantifying the price/volume relationship and displaying the results in the form of an oscillator. Generally, when the oscillator is in a positive area, prices are advancing with relative ease. On the other hand, when the oscillator is in negative territory, prices are falling with relative ease.
#### Interpretation
When the EOM is moving away from the zero line (marker) then an impulse has begun in that direction. During a breakout onto the opposite side of the zero line, it is recommended to enter with the trend direction.
#### Further information
[http://www.volumen-analyse.de](http://www.volumen-analyse.de/)
#### Usage
```csharp
EaseOfMovement(int smoothing, int volDivisor)
EaseOfMovement(IDataSeries inSeries, int smoothing, int volDivisor)
EaseOfMovement(int smoothing, int volDivisor)[int barsAgo]
EaseOfMovement(IDataSeries inSeries, int smoothing, int volDivisor)[int barsAgo]
```
#### Return value
**double**
When using this method with an index (e.g. **EaseOfMovement**(14, 10000)\[**int** barsAgo] ), the value of the indicator will be issued for the referenced bar.
#### Parameters
inSeries Input data series for the indicator
smoothing Smoothing settings
volDivisor For calculation of the box ratio (see “Calculation” below)
#### Visualization
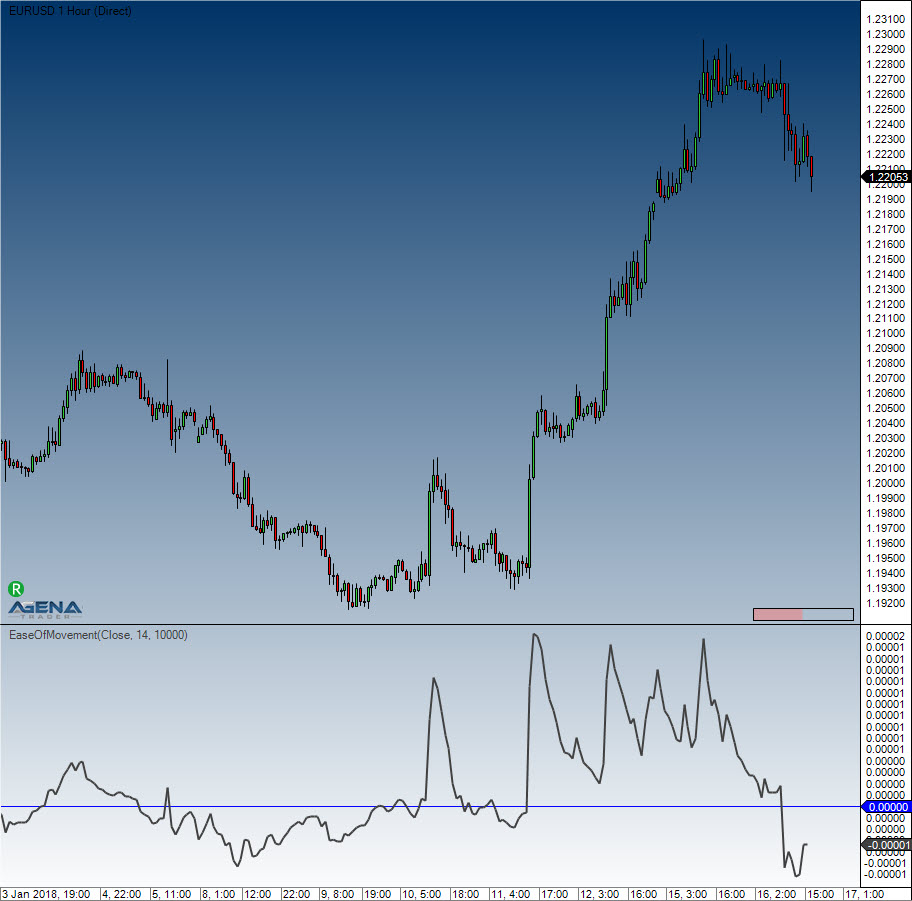
#### Calculation
Midpoint = (High + Low) / 2 MidpointMove = Midpoint \[today] – Midpoint \[yesterday] BoxRatio = Volume / (High – Low) Ease = MidpointMove / Box Ratio
#### Example
```csharp
//Output for the values of the EOM line
Print("The value for the Ease of Movement is: " + EaseOfMovement(14, 10000)[0]);
```