> For the complete documentation index, see [llms.txt](https://indicators.agenatrader.com/llms.txt). Markdown versions of documentation pages are available by appending `.md` to page URLs; this page is available as [Markdown](https://indicators.agenatrader.com/standard-indicators/average-true-range-atr.md).
# Average True Range (ATR)
#### Description & Interpretation
The Average True Range (ATR), which was developed by J. Welles Wilder, is an indicator that measures volatility. As is true for most of his indicators, Wilder designed the ATR with commodities and daily prices in mind. Commodities are often more volatile than stocks, and frequently experience gaps and limit moves, which happen when a commodity opens up or down its maximum allowed move for the session. A volatility formula that was based on the high-low range only would be unable to capture volatility from gap or limit moves. Wilder, therefore, developed the Average True Range to capture this "missing" volatility. Keep in mind that ATR does not provide an indication of price direction, but merely volatility.
The ATR is featured in Wilder’s 1978 book, New Concepts in Technical Trading Systems, which also goes into detail about the Parabolic SAR, RSI and the Directional Movement Concept (ADX). Despite having been developed before the computer age, Wilder's indicators are equally functional today and remain extremely popular.
The starting point for Wilder was a concept called **True Range (TR)**, which is defined as the greatest of the following: - Method 1: current high minus the current low - Method 2: current high minus the previous close (absolute value) - Method 3: current Low minus the previous close (absolute value)
Absolute values are used for ensuring positive numbers, since Wilder was interested in measuring the distance between two points, not the direction. If the current period's high is above the prior period's high and the low is below the prior period's low, then the current period's high-low range will be used as the True Range. This is an outside day that would use method 1 to calculate the TR, and is quite straightforward. Methods 2 and 3 are used whenever there is a gap or inside day. A gap occurs when the previous close is greater than the current high (indicating a potential gap down or limit move) or the previous close is lower than the current low (indicating a potential gap up or limit move). The image below shows examples of when methods 2 and 3 are appropriate.
#### Further information
VTAD:
#### Usage
```csharp
ATR(int period)
ATR(IDataSeries inSeries, int period)
ATR(int period)[int barsAgo]
ATR(IDataSeries inSeries, int period)[int barsAgo]
```
#### Return value
**double**
When using this method with an index (e.g. **ATR**(14)\[**int** barsAgo] ), the value of the indicator will be outputted for the referenced bar.
#### Parameters
inSeries Input data series for the indicator
period Number of bars included in the calculation
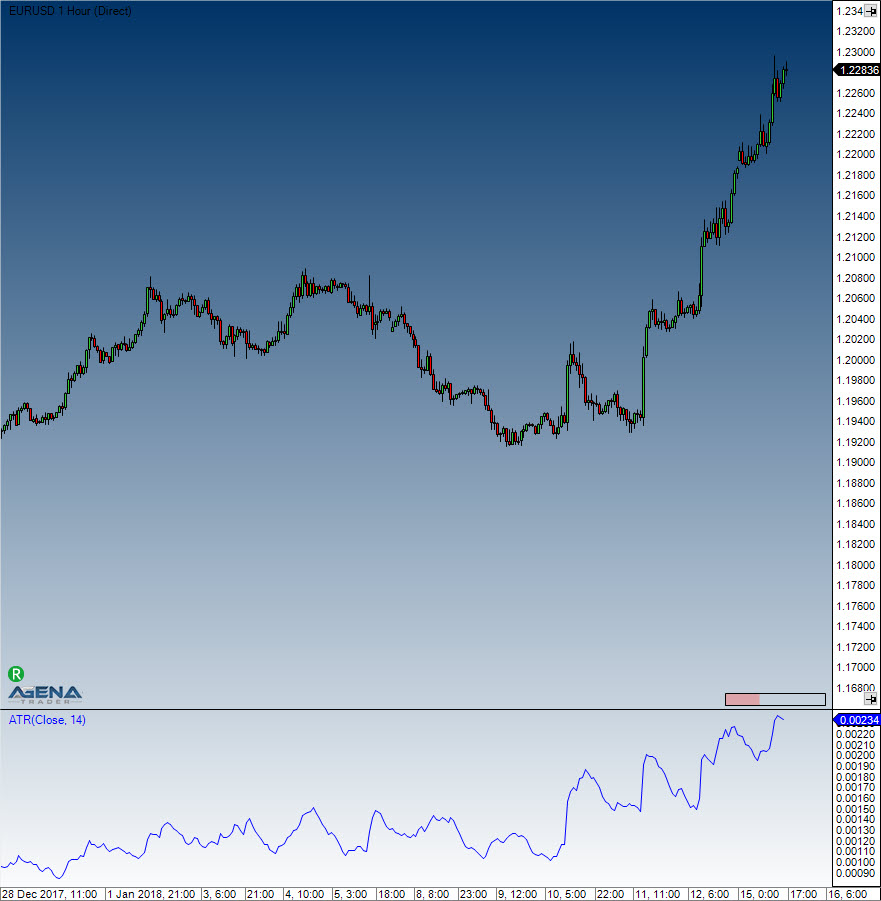
#### Visualization
#### Example
```csharp
//Output of the current value of a 14 period ATR
Print("The current ATR value is: " + ATR(14)[0]);
```