> For the complete documentation index, see [llms.txt](https://indicators.agenatrader.com/llms.txt). Markdown versions of documentation pages are available by appending `.md` to page URLs; this page is available as [Markdown](https://indicators.agenatrader.com/standard-indicators/linear-regression.md).
# Linear Regression
#### Description
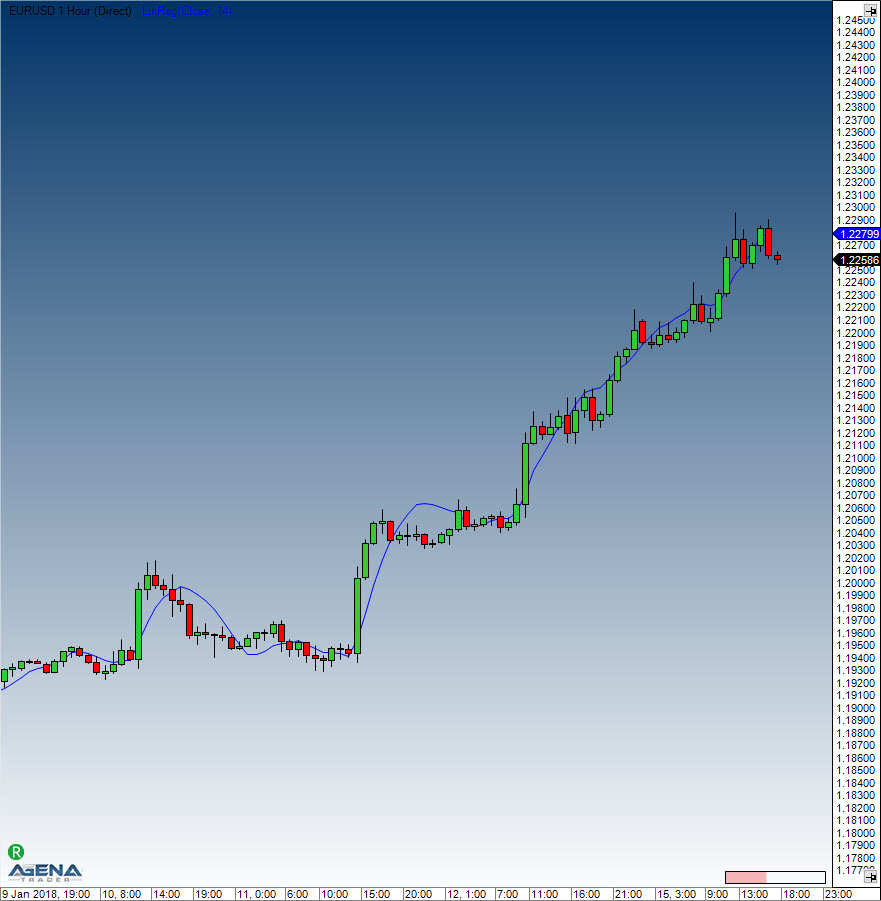
Linear Regression is used to determine trends. Here, the prices are set as dependent variables, and time is set as an independent variable. Using the method for determination of the smallest square, a straight line is placed through the price movements in such a way that the distance between the prices and the line deviates as little as possible. Using this method also establishes a trend between two points in time. The regression line can be found in the middle of the price channel, and the indicator provides the end values of multiple linear regression trend lines. Each point along this indicator is therefore an end value of a linear regression trend line. What results is quite similar to a smoothing average, with the difference that the regression line exhibits less lag.
See [*R-Squared*](https://agenatrader.github.io/AgenaIndicator-documentation/indicators_oscillators/#r-squared), [*LinRegSlope*](https://agenatrader.github.io/AgenaIndicator-documentation/indicators_oscillators/#linregslope), [*LinRegIntercept*](https://agenatrader.github.io/AgenaIndicator-documentation/indicators_oscillators/#linregintercept).
#### Further information
#### Interpretation
The linear regression indicator is used as a prognosis tool for the future developments of the instrument. If the prices are rising or falling steadily, then it can be expected that they will return to a more realistic/reasonable level. In other words: the indicator shows where the price should be, a deviation from the regression is assumed to be short-lived and to be corrected soon.
#### Usage
```csharp
LinReg(int period)
LinReg(IDataSeries inSeries, int period)
LinReg(int period)[int barsAgo]
LinReg(IDataSeries inSeries, int period)[int barsAgo]
```
#### Return value
**double**
When using this method with an index (e.g. **LinReg**(14)\[**int** barsAgo] ), the value of the indicator will be issued for the referenced bar.
#### Parameters
inSeries Input data series for the indicator
period Number of bars included in the calculations
#### Visualization
#### Example
```csharp
//Show the current values of the regression line
Print("The current value for the linear regression is: " + LinReg(14)[0]);
```