> For the complete documentation index, see [llms.txt](https://indicators.agenatrader.com/llms.txt). Markdown versions of documentation pages are available by appending `.md` to page URLs; this page is available as [Markdown](https://indicators.agenatrader.com/standard-indicators/range-indicator-rind.md).
# Range Indicator (RIND)
#### Description
Jack Weinberg created the Range Indicator (RIND), which was first published in 1954. The RIND compares the intraday span (range) between the high and low to the span (range) between the current closing price and the closing price from the day before.
#### Interpretation
When the span between the current close and the previous days close is bigger than the intraday span between high and low, the indicator will display a high value. This signals a potential trend change...
#### Further information
#### Usage
```csharp
RIND(int periodQ, int smooth)
RIND(IDataSeries inSeries, int periodQ, int smooth)
RIND(int periodQ, int smooth)[int barsAgo]
RIND(IDataSeries inSeries, int periodQ, int smooth)[int barsAgo]
```
#### Return value
**double**
When using this method with an index (e.g. **RIND**(3,10)\[**int** barsAgo] ), the value of the indicator will be issued for the referenced bar.
#### Parameters
inSeries Input data series for the indicator
periodQ Number of bars used for the short-term stochastic
smooth Number of bars used for smoothing the indicator (using an EMA)
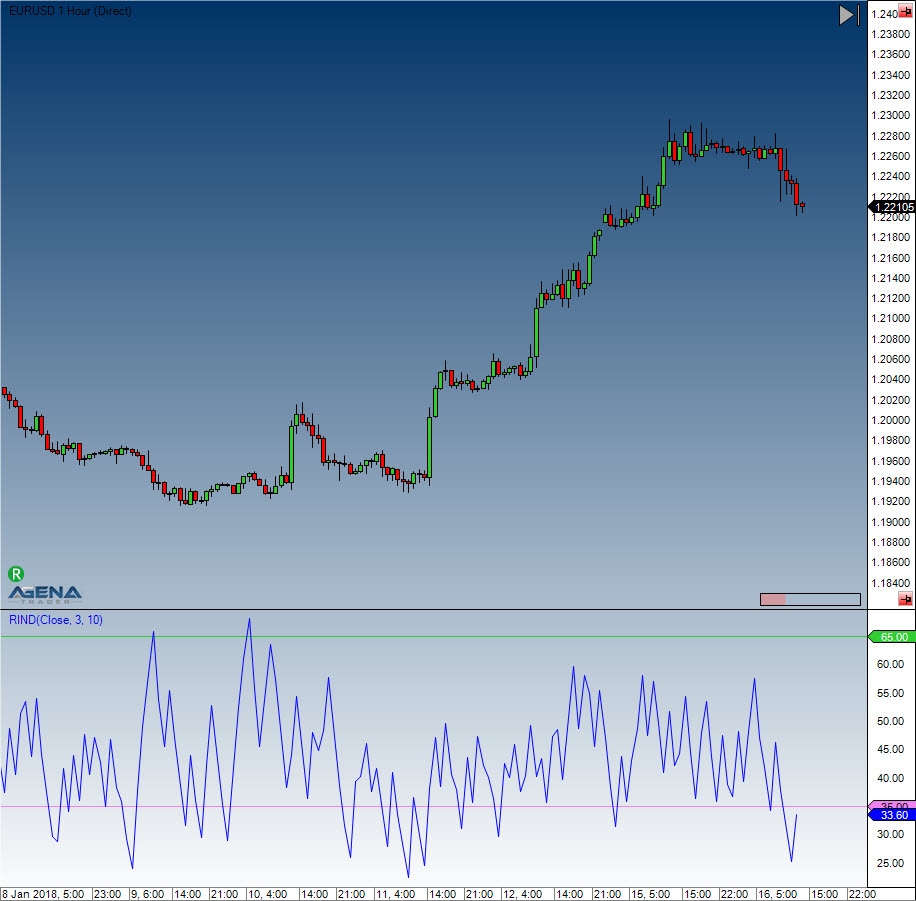
#### Visualization
#### Example
```csharp
//Output
Print("The current value for the PFE is: " + RIND(3, 10)[0]);
```