> For the complete documentation index, see [llms.txt](https://indicators.agenatrader.com/llms.txt). Markdown versions of documentation pages are available by appending `.md` to page URLs; this page is available as [Markdown](https://indicators.agenatrader.com/standard-indicators/average-directional-movement-rating-adxr.md).
# Average Directional Movement Rating (ADXR)
#### Description
The ADXR is the ADX indicator plus the ADX from n days ago divided by 2. Written as an equation, it looks like this: (current ADX + ADX n days ago) / 2.
#### Interpretation
The oscillator moves along a guiding line that typically has a value of 20. When the ADXR rises above 20, a trend exists. If the ADXR is below 20, no trend exists and the market is moving sideways. Welles Wilder recommends buying into the market at a value of 25 and higher, and holding the position as long as the value remains above 20.
#### Usage
```csharp
ADXR(int interval, int period)
ADXR(IDataSeries inSeries, int interval, int period)
ADXR(int interval, int period)[int barsAgo]
ADXR(IDataSeries inSeries, int interval, int period)[int barsAgo]
```
#### Return value
**double**
When using this method with an index (e.g. **ADXR**(10, 14)\[**int** barsAgo]), the value of the indicator will be outputted for the referenced bar.
#### Parameters
inSeries Input data series for the indicator
interval Interval between the first ADX value and the current ADX value
period Number of bars included in the calculation
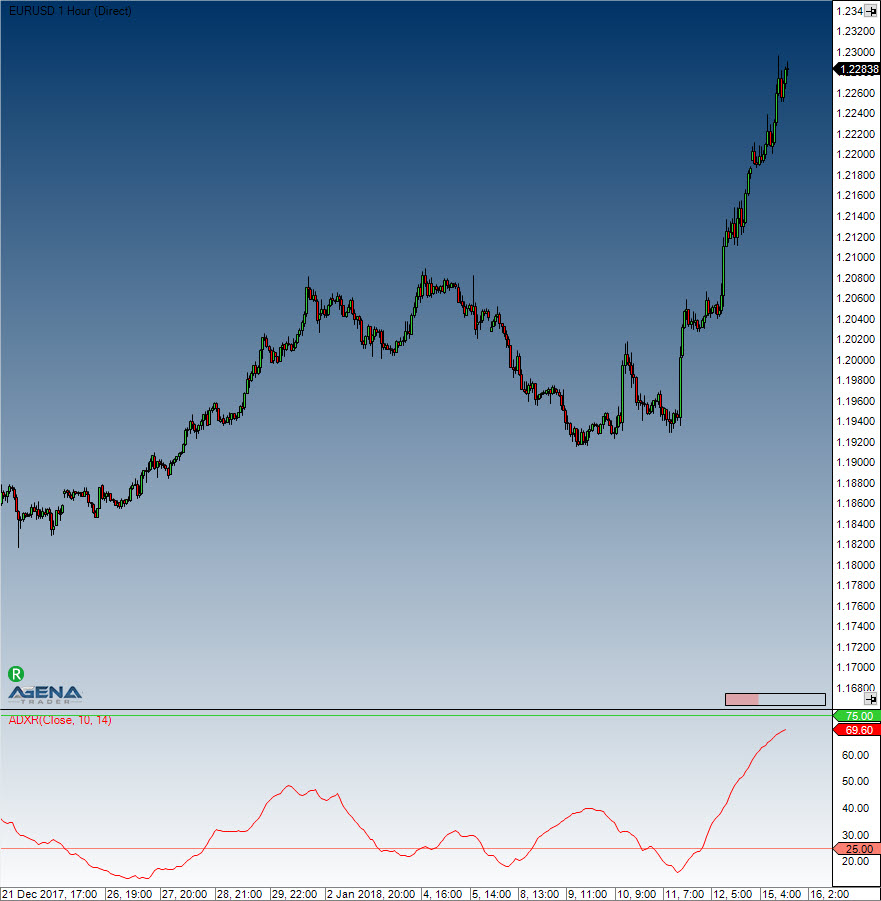
#### Visualization
#### Example
```csharp
//Output of the current value of the ADXR
Print("Value of the ADXR: " + ADXR(10, 14)[0]);
```