> For the complete documentation index, see [llms.txt](https://indicators.agenatrader.com/llms.txt). Markdown versions of documentation pages are available by appending `.md` to page URLs; this page is available as [Markdown](https://indicators.agenatrader.com/premium-indicators/dowtheory-addon/p123.md).
# P123
**The installation of the Technical Analysis Package is required in order to access this indicator.**
#### Description
The goal of the P123 indicator is to automatically detect a 1-2-3 pattern.
**The following features make it stand out:**
Innovative recognition of 4 different trend sizes
It recognizes points 1, 2, and 3 at the bar
Recognition of a trend continuation in the same direction as a trend break
Completely automatic adjustment of the search algorithm for all possible market conditions (no additional settings/inputs required)
Adaptive workflow, adjusting to any volatility fluctuations
Clear overview while simultaneously displaying the various trend sizes
Can be implemented within the Condition Escort and AgenaScript
The trend sizes are defined as follows:
T0 = large trend
T1 = medium-sized trend
T2 = small trend
T3 = smallest trend size
The smallest trend size (T3) cannot be detected on all trading instruments. Point 2 is often situated at the high of a bar, and point 3 at the low of the same bar. Depending on the timeframe and fluctuation range, T0 and T1 can be fused into one.
The indicator determines the selected timeframe of the chart, and then labels all trends and trend sizes accordingly. When there is low volatility, trend recognition is more sensitive, and the vice versa for higher volatility. The P123’s adaptive methods make for a balanced recognition of trend sizes.
**Important tip:**
In some cases, the large trend (T0) cannot be seen with the naked eye, which may be due to the fact that not enough candles are visible within the chart. A minimum of 500 candles should be loaded to ensure this is not the case.
#### Interpretation
Trading signals often form at points 2 & 3: at point 3 as entry signals into a correction phase within a confirmed trend, and at point 2 as a sub-trend in the trend direction of the superior trade. The definition of a trend at points 1 to 3 can be read in "*Das große Buch der Markttechnik*" by Michael Voigt (German only).
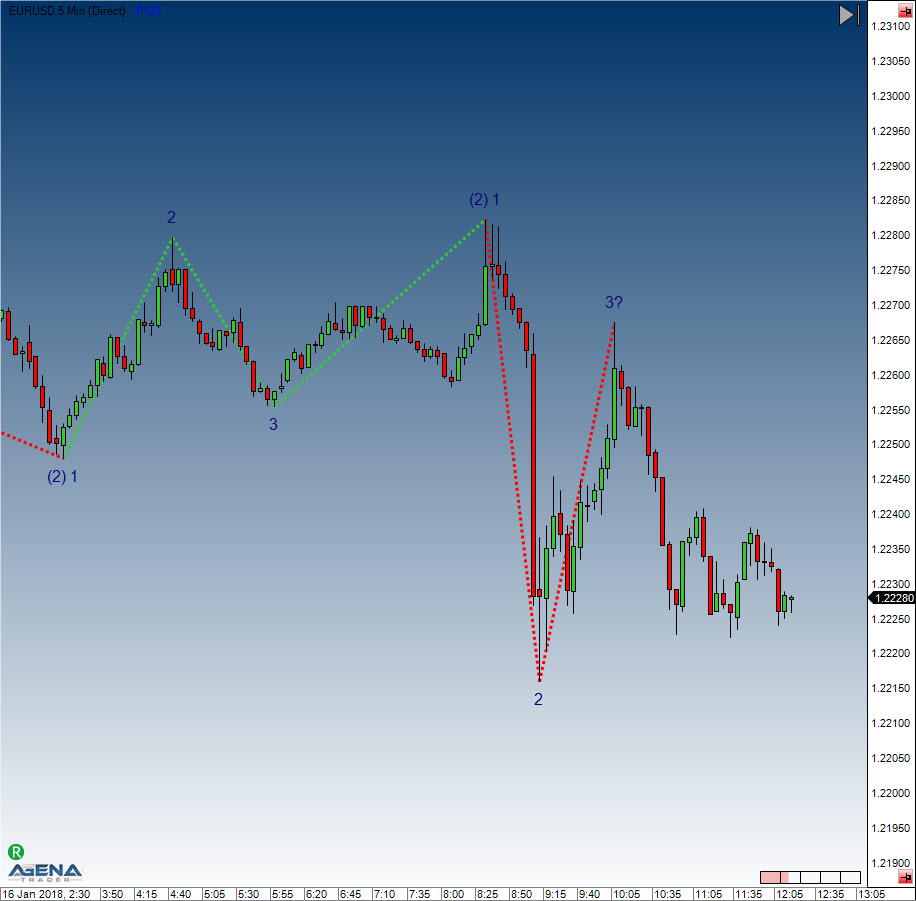
#### Visualization in the chart
The parameter input settings define which trend sizes are shown in the chart and whether or not they are connected by a line.
For the default settings, the trend T2 is enabled by default.
The depiction in the chart may change with the changing market movements. If the market moves below the last point 3 and breaks the uptrend, the point is marked with a “3?”. The newly created low becomes the new point 2 and the last point 2 becomes point 1.
The parameter settings are not relevant for the display in the chart and are primarily used for the Condition Escort.
The depiction in the chart is primarily influenced by the settings “Display 123” and “Display Lines”.
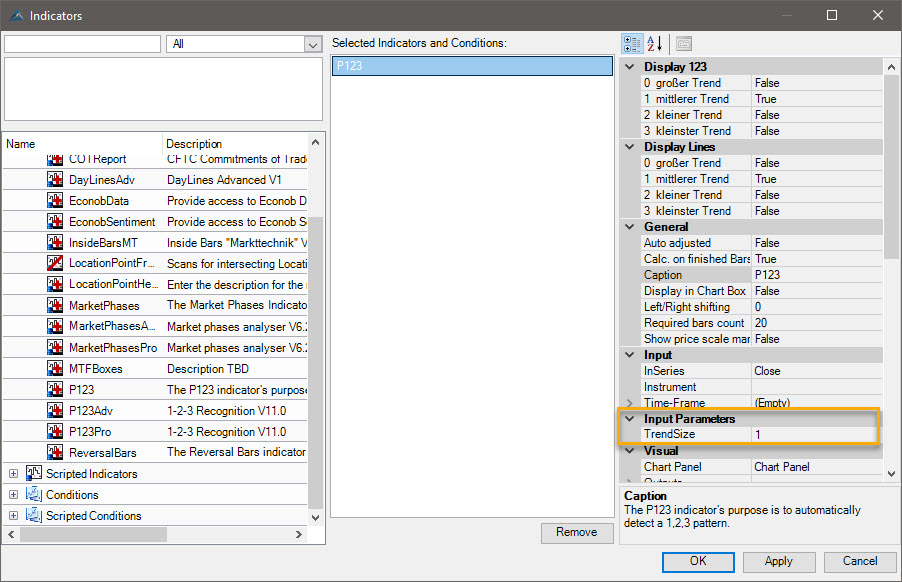
The settings highlighted in yellow have no influence on the chart. No changes need to be made.
#### Usage in AgenaScript
When using P123 in AgenaScript, multiple public variables are available.
A notation such as \[barsAgo] is not available for this. Parameter occurrences are used in the following manner:
**P123**(**int** trendSize). ... <\>
**P123**(**int** trendSize, **int** occurrence). ...
| | |
| ------------------------------------------- | --------------------------------------------------------------------------------------------------------------------------------- |
| Trend Direction | 1 = uptrend -1 = downtrend 0 = no trend |
| IsTrendValid | true = confirmed trend with a point sequence of at least 1 - 2 - 3 - 2 |
| false = no confirmed trend (phases 1 and 2) | |
| LastPoint | last point of a trend, 1, 2 or 3 |
| LastPointPrice | outputs the price value of the last market point |
| LastPointDateTime | outputs the date and time of the last market point |
| P1Price | outputs the value of the last point 1 |
| P1DateTime | outputs the value and date/time of the last point 1 |
| P2Price | outputs the value of the last point 2 |
| P2DateTime | outputs the time and date of point 2 |
| TempP3Price | putputs the value of the temporary point “3?” |
| TempP3DateTime | outputs the time and date of the temporary point “3?” |
| ValidP3Price | outputs the value of the last point 3. This is used as a stop placement. When this point is breached, a trend change is confirmed |
| ValidP3DateTime | outputs the date and time for the last valid point 3 |
**Parameters**
trendsize: trend size from 0 .. 3
occurrence the occurrences of the youngest to the oldest point
**Example**
```csharp
private void PrintOutTrendProperties(int trendSize)
{
// Reverse order of prints fills output window in correct order
Print("");
Print("valid P3 date: " + P123(trendSize).ValidP3DateTime);
Print("valid P3 price: " + P123(trendSize).ValidP3Price);
Print("temp P3 date: " + P123(trendSize).TempP3DateTime);
Print("temp P3 price: " + P123(trendSize).TempP3Price);
Print("P2 date: " + P123(trendSize).P2DateTime);
Print("P2 price: " + P123(trendSize).P2Price);
Print("P1 date: " + P123(trendSize).P1DateTime);
Print("P1 price: " + P123(trendSize).P1Price);
Print("last point date: " + P123(trendSize).LastPointDateTime);
Print("last point price: " + P123(trendSize).LastPointPrice);
Print("last point: " + P123(trendSize).LastPoint);
Print("is trend valid: " + P123(trendSize).IsTrendValid);
Print("trend direction: " + P123(trendSize).TrendDirection);
}
```
#### Utilization within the Condition Escort
All public variables are available to you inside the Condition Escort as data series; they can be found under „Series & Output Values“. The name has an underscore ("\_") suffix in order to differentiate it.
The parameters “trendSize” and “occurrence” can be found within the Condition Escort.