Indicators
HomeIndicatorsAgenaScriptRelease Notes
  • 📒AgenaTrader Indicators Introduction
  • STANDARD INDICATORS
    • Accumulation/Distribution (ADL)
    • Adaptive Price Zone (APZ)
    • Aroon
    • Aroon Oscillator
    • Average Directional Index (ADX)
    • Average Directional Movement Rating (ADXR)
    • Average True Range (ATR)
    • BBBreakOutSpeed
    • Balance of Power (BOP)
    • Bollinger Bands
    • Bollinger Percent B (%b)
    • Bollinger Band Width (BBWidth)
    • Bollinger MTF (MultiTimeFrame)
    • BuySellPressure
    • BuySellVolume
    • CandleStickPattern
    • ChaikinMoneyFlow (CMF)
    • Chaikin Oscillator
    • ChaikinVolatility (CVL)
    • Chande Momentum Oscillator (CMO)
    • Climactic Distance
    • Commodity Channel Index (CCI)
    • Directional Movement (DM)
    • Donchian Channel
    • Directional Movement Index (DMI)
    • Double Stochastics (DSS)
    • Dynamic Momentum Index (DMIndex)
    • Ease of Movement (EOM)
    • Fisher Transform
    • Forecast Oscillator (FOSC)
    • HighestHighIndex()
    • HighestHighPrice()
    • IchimokuCloud
    • Keltner Channel
    • KeyReversalUp
    • KeyReversalDown
    • KeyReversalUpAtSMA
    • KeyReversalDownAtSMA
    • KeyReversalUpAtEMA
    • KeyReversalDownAtEMA
    • Linear Regression
    • LinRegIntercept
    • LinRegSlope
    • LowestLowIndex()
    • LowestLowPrice()
    • MACD
    • MAEnvelopes
    • Momentum (MOM)
    • Money Flow Index (MFI)
    • Moving Averages
      • DEMA - Double Exponential Moving Average
      • EMA - Exponential Moving Average
      • EMA MTF (MultiTimeFrame)
      • HMA - Hull Moving Average
      • KAMA - Kaufman's Adaptive Moving Average
      • MAMA - Mesa Adaptive Moving Average
      • SMA - Simple Moving Average
      • GapSMA - Gap Simple Moving Average
      • SMA MTF (MultiTimeFrame)
      • SMMA - Smoothed Moving Average
      • TEMA - Triple Exponential Moving Average
      • TMA - Triangular Moving Average
      • TRIX - Triple Exponential Moving Average
      • T3 - Triple Exponential Moving Average
      • VMA - Variable Moving Average
      • VWMA - Volume Weighted Moving Average
      • WMA - Weighted Moving Average
      • ZLEMA - Zero Lag Exponential Moving Average
    • nBarsUp
    • nBarsDown
    • OnBalanceVolume (OBV)
    • OutsideBars
    • Parabolic SAR
    • Percentage Price Oscillator (PPO)
    • PercentEnvelopes
    • Pivot Points
    • Polarized Fractal Efficiency (PFE)
    • Price Oscillator
    • Rainbow
    • Range
    • Range Indicator (RIND)
    • Rate of Change (ROC)
    • Relative Performance
    • Relative Spread Strength (RSS)
    • Relative Strength Index (RSI)
    • Relative Strength Levy (RSL)
    • Relative Volatility Index (RVI)
    • R-Squared
    • Standard Error (StdError)
    • Stochastics
    • Stochastics Fast
    • Stochastics RSI (StochRSI)
    • Summation (SUM)
    • SuperTrend
    • SupportResistanceAreas
    • Swing
    • Time-Series-Forecast (TSF)
    • Constant Lines
    • CurrentDayOHL
    • Daily Performance
    • DailyQuoteMoves
    • DayLines
    • GetDayBar
    • Info
    • Maximum (MAX)
    • Minimum (MIN)
    • PriceLine
    • PriorDayOHLC
    • PriorDayOHLCext
    • SessionBreakLines
    • ShowBidAsk
    • TickCounter
    • True Strength Index (TSI)
    • Ultimate Oscillator
    • Volume (VOL)
    • Volume Moving Average (VOLMA)
    • Volume Profile
    • Volume Rate of Change (VROC)
    • VolumeUpDown
    • Williams %R
    • ZigZag
  • PREMIUM INDICATORS
    • COT AddOn
      • COTLargeTraderActivity
      • COTStockDummy
      • COTReportLegacy
      • COTReportDisaggregated
      • COTOpenInterestLegacy
      • COTOpenInterestDisaggregated
      • COTCommercialIndex
      • COTAggregatedIndexPositionDisaggregated
    • DowTheory AddOn
      • DayLinesAdv
      • InsideBarsMT
      • MarketPhases
      • MarketPhases Pro
      • MTFBoxes
      • OutsideBars
      • P123
      • P123Pro
      • ReversalBars
    • Darvas AddOn
      • Darvas Boxes
    • Relative Currency Strength (RCS)
    • Volume AddOn
      • KlingerVolumeOscillator
      • Volume Oscillator
      • VolumeArea
      • VolumeGraph
      • VolumeKeltnerChannels
      • VolumeRiseFall
      • VolumeSentimentLong
      • VolumeSentimentShort
      • VolumeSessionPro
      • VolumeTickSpeed
      • VolumeUDR
      • Volume Zones
      • VolumeZoneOscillator
      • WyckoffWave
Powered by GitBook
On this page
Edit on GitLab
  1. STANDARD INDICATORS

Volume Moving Average (VOLMA)

Last updated 3 years ago

Description

The VOLMA calculation is carried out by applying an exponential moving average to the respective volume of each period, that is to say its EMA (volume).

Caution: In trading literature, the Volume Moving Average is often confused with the abbreviation for the Variable Moving Average (VMA).

Interpretation

The VOLMA indicator helps you to find and assess the relative volume of a period.

Some simple guidelines should be followed:

The volume should be above the VOLMA at a break

After a volume spike (high), an exhaustion phase will kick in. The exhaustion can lead to a complete reversal of the price movement. Generally speaking, however, this is simply a resting phase

After three successive volume spikes, it becomes much less likely that the situation will continue in the same direction

Here, you can find more general information about Moving Averages.

Further information

Volumen-Analyse.de:

Usage

VOLMA(int period)
VOLMA(IDataSeries inSeries, int period)
VOLMA(int period)[int barsAgo]
VOLMA(IDataSeries inSeries, int period)[int barsAgo]

Return value

double

When using this method with an index (e.g. VOLMA(14)[int barsAgo] ), the value of the indicator will be issued for the referenced bar.

Parameters

inSeries Input data series for the indicator

period Number of bars included in the calculations
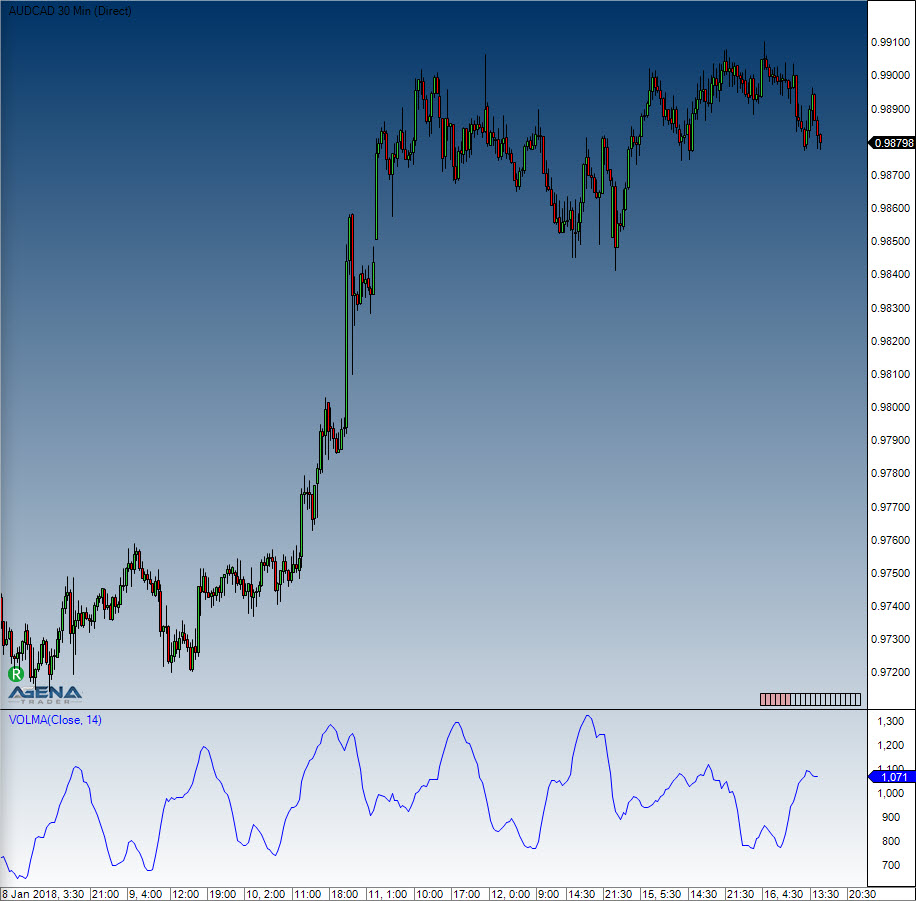
Visualization

Example

//Output for the value of the Volume Moving Average (VOLMA)
Print("The current VOLMA value is " + VOLMA(14)[0]);
Volume Moving Average (VOLMA)
http://www.volumen-analyse.de