Indicators
HomeIndicatorsAgenaScriptRelease Notes
  • 📒AgenaTrader Indicators Introduction
  • STANDARD INDICATORS
    • Accumulation/Distribution (ADL)
    • Adaptive Price Zone (APZ)
    • Aroon
    • Aroon Oscillator
    • Average Directional Index (ADX)
    • Average Directional Movement Rating (ADXR)
    • Average True Range (ATR)
    • BBBreakOutSpeed
    • Balance of Power (BOP)
    • Bollinger Bands
    • Bollinger Percent B (%b)
    • Bollinger Band Width (BBWidth)
    • Bollinger MTF (MultiTimeFrame)
    • BuySellPressure
    • BuySellVolume
    • CandleStickPattern
    • ChaikinMoneyFlow (CMF)
    • Chaikin Oscillator
    • ChaikinVolatility (CVL)
    • Chande Momentum Oscillator (CMO)
    • Climactic Distance
    • Commodity Channel Index (CCI)
    • Directional Movement (DM)
    • Donchian Channel
    • Directional Movement Index (DMI)
    • Double Stochastics (DSS)
    • Dynamic Momentum Index (DMIndex)
    • Ease of Movement (EOM)
    • Fisher Transform
    • Forecast Oscillator (FOSC)
    • HighestHighIndex()
    • HighestHighPrice()
    • IchimokuCloud
    • Keltner Channel
    • KeyReversalUp
    • KeyReversalDown
    • KeyReversalUpAtSMA
    • KeyReversalDownAtSMA
    • KeyReversalUpAtEMA
    • KeyReversalDownAtEMA
    • Linear Regression
    • LinRegIntercept
    • LinRegSlope
    • LowestLowIndex()
    • LowestLowPrice()
    • MACD
    • MAEnvelopes
    • Momentum (MOM)
    • Money Flow Index (MFI)
    • Moving Averages
      • DEMA - Double Exponential Moving Average
      • EMA - Exponential Moving Average
      • EMA MTF (MultiTimeFrame)
      • HMA - Hull Moving Average
      • KAMA - Kaufman's Adaptive Moving Average
      • MAMA - Mesa Adaptive Moving Average
      • SMA - Simple Moving Average
      • GapSMA - Gap Simple Moving Average
      • SMA MTF (MultiTimeFrame)
      • SMMA - Smoothed Moving Average
      • TEMA - Triple Exponential Moving Average
      • TMA - Triangular Moving Average
      • TRIX - Triple Exponential Moving Average
      • T3 - Triple Exponential Moving Average
      • VMA - Variable Moving Average
      • VWMA - Volume Weighted Moving Average
      • WMA - Weighted Moving Average
      • ZLEMA - Zero Lag Exponential Moving Average
    • nBarsUp
    • nBarsDown
    • OnBalanceVolume (OBV)
    • OutsideBars
    • Parabolic SAR
    • Percentage Price Oscillator (PPO)
    • PercentEnvelopes
    • Pivot Points
    • Polarized Fractal Efficiency (PFE)
    • Price Oscillator
    • Rainbow
    • Range
    • Range Indicator (RIND)
    • Rate of Change (ROC)
    • Relative Performance
    • Relative Spread Strength (RSS)
    • Relative Strength Index (RSI)
    • Relative Strength Levy (RSL)
    • Relative Volatility Index (RVI)
    • R-Squared
    • Standard Error (StdError)
    • Stochastics
    • Stochastics Fast
    • Stochastics RSI (StochRSI)
    • Summation (SUM)
    • SuperTrend
    • SupportResistanceAreas
    • Swing
    • Time-Series-Forecast (TSF)
    • Constant Lines
    • CurrentDayOHL
    • Daily Performance
    • DailyQuoteMoves
    • DayLines
    • GetDayBar
    • Info
    • Maximum (MAX)
    • Minimum (MIN)
    • PriceLine
    • PriorDayOHLC
    • PriorDayOHLCext
    • SessionBreakLines
    • ShowBidAsk
    • TickCounter
    • True Strength Index (TSI)
    • Ultimate Oscillator
    • Volume (VOL)
    • Volume Moving Average (VOLMA)
    • Volume Profile
    • Volume Rate of Change (VROC)
    • VolumeUpDown
    • Williams %R
    • ZigZag
  • PREMIUM INDICATORS
    • COT AddOn
      • COTLargeTraderActivity
      • COTStockDummy
      • COTReportLegacy
      • COTReportDisaggregated
      • COTOpenInterestLegacy
      • COTOpenInterestDisaggregated
      • COTCommercialIndex
      • COTAggregatedIndexPositionDisaggregated
    • DowTheory AddOn
      • DayLinesAdv
      • InsideBarsMT
      • MarketPhases
      • MarketPhases Pro
      • MTFBoxes
      • OutsideBars
      • P123
      • P123Pro
      • ReversalBars
    • Darvas AddOn
      • Darvas Boxes
    • Relative Currency Strength (RCS)
    • Volume AddOn
      • KlingerVolumeOscillator
      • Volume Oscillator
      • VolumeArea
      • VolumeGraph
      • VolumeKeltnerChannels
      • VolumeRiseFall
      • VolumeSentimentLong
      • VolumeSentimentShort
      • VolumeSessionPro
      • VolumeTickSpeed
      • VolumeUDR
      • Volume Zones
      • VolumeZoneOscillator
      • WyckoffWave
Powered by GitBook
On this page
Edit on GitLab
  1. STANDARD INDICATORS

Climactic Distance

Last updated 3 years ago

Description

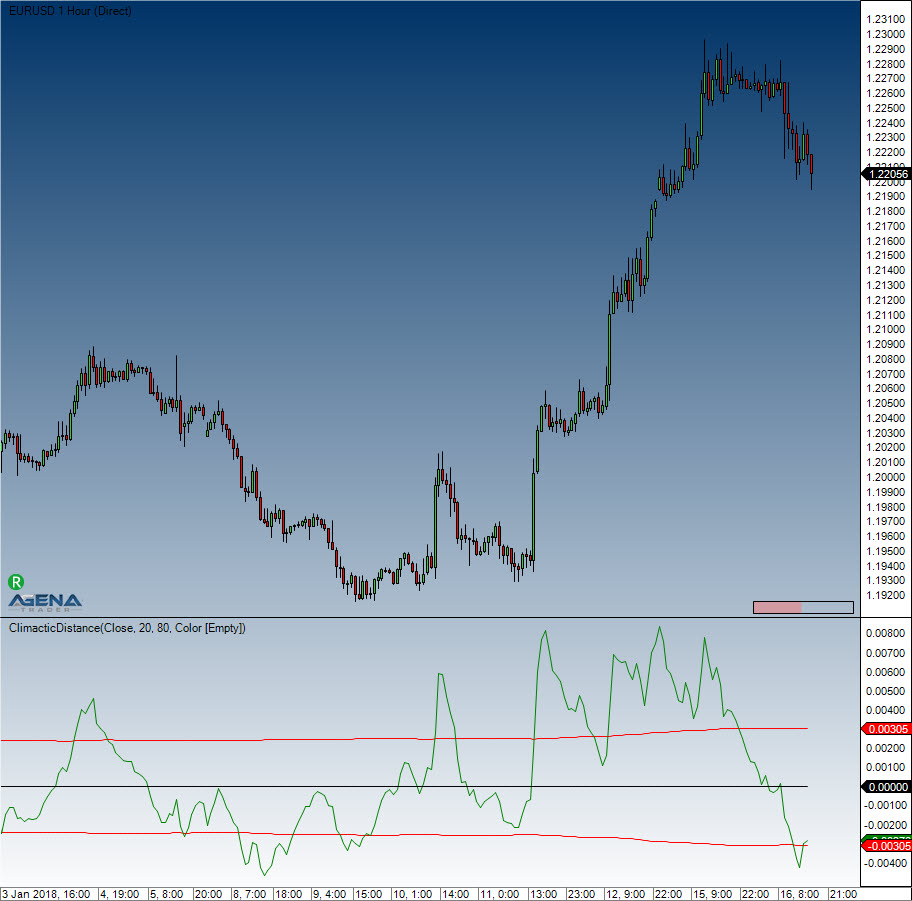
The Climactic Distance indicator was invented and developed by Gilbert Kreuzthaler, CEO of Include IT GmbH and founder of AgenaTrader.com. This indicator is used in the Location Point Trading system. It calculates the median course of the current and historical candle at a distance to the simple moving average (SMA) of the last 20 periods. Additionally, it also measures the average course deviation within the last 80 periods. If the median course exceeds the top or bottom course deviation, the market is deemed climactic, and this influences the trading decisions made in Location Point Trading.

Calcualtion

Black line in the middle: SMA 20 Green moving line: Median Kurs Red upper and lower line: Average course deviation oft he last 80 periods.

More information

Usage

ClimacticDistance(int sMAPeriod, int thresholdPercent)
ClimacticDistance(IDataSeries InSeries, int sMAPeriod, int thresholdPercent)
ClimacticDistance(int period, int tresholdPercent, Color climacticColor)
ClimacticDistance(IDataSeries InSeries, int sMAPeriod, int thresholdPercent, Color climacticColor)
//Upper band
ClimacticDistance(int sMAPeriod, int thresholdPercent).Upper[int barsAgo]
ClimacticDistance(IDataSeries InSeries, int sMAPeriod, int thresholdPercent).Upper[int barsAgo]
ClimacticDistance(int period, int tresholdPercent, Color climacticColor).Upper[int barsAgo]
ClimacticDistance(IDataSeries InSeries, int sMAPeriod, int thresholdPercent, Color climacticColor).Upper[int barsAgo]
//Lower band
ClimacticDistance(int sMAPeriod, int thresholdPercent).Lower[int barsAgo]
ClimacticDistance(IDataSeries InSeries, int sMAPeriod, int thresholdPercent).Lower[int barsAgo]
ClimacticDistance(int period, int tresholdPercent, Color climacticColor).Lower[int barsAgo]
ClimacticDistance(IDataSeries InSeries, int sMAPeriod, int thresholdPercent, Color climacticColor).Lower[int barsAgo]

//MovingAverage
ClimacticDistance(int sMAPeriod, int thresholdPercent).MovingAverage[int barsAgo]
ClimacticDistance(IDataSeries InSeries, int sMAPeriod, int thresholdPercent).MovingAverage[int barsAgo]
ClimacticDistance(int period, int tresholdPercent, Color climacticColor).MovingAverage[int barsAgo]
ClimacticDistance(IDataSeries InSeries, int sMAPeriod, int thresholdPercent, Color climacticColor).MovingAverage[int barsAgo]
//Distance
ClimacticDistance(int sMAPeriod, int thresholdPercent).Distance[int barsAgo]
ClimacticDistance(IDataSeries InSeries, int sMAPeriod, int thresholdPercent).Distance[int barsAgo]
ClimacticDistance(int period, int tresholdPercent, Color climacticColor).Distance[int barsAgo]
ClimacticDistance(IDataSeries InSeries, int sMAPeriod, int thresholdPercent, Color climacticColor).Distance[int barsAgo]

Return value

double

Parameters

Int

Visualization

Example

//Output of the value for the Upper climactic distance line
Print(“Value of the upper band: “ + ClimacticDistnance(20, 80).Upper[0]);
//Output of the value for the Lower climactic distance line
Print(“Value of the upper band: “ + ClimacticDistnance(20, 80).Lower[0]);
//Output of the value for the Distance climactic distance line
Print(“Value of the upper band: “ + ClimacticDistnance(20, 80).Distance[0]);
//Output of the value for the Moving Average climactic distance line
Print(“Value of the upper band: “ + ClimacticDistnance(20, 80).MovingAverage[0]);
Climactic Distance
https://www.facebook.com/Location-Point-Trading-344217482287592/?fref=ts