> For the complete documentation index, see [llms.txt](https://indicators.agenatrader.com/llms.txt). Markdown versions of documentation pages are available by appending `.md` to page URLs; this page is available as [Markdown](https://indicators.agenatrader.com/standard-indicators/dailyquotemoves.md).
# DailyQuoteMoves
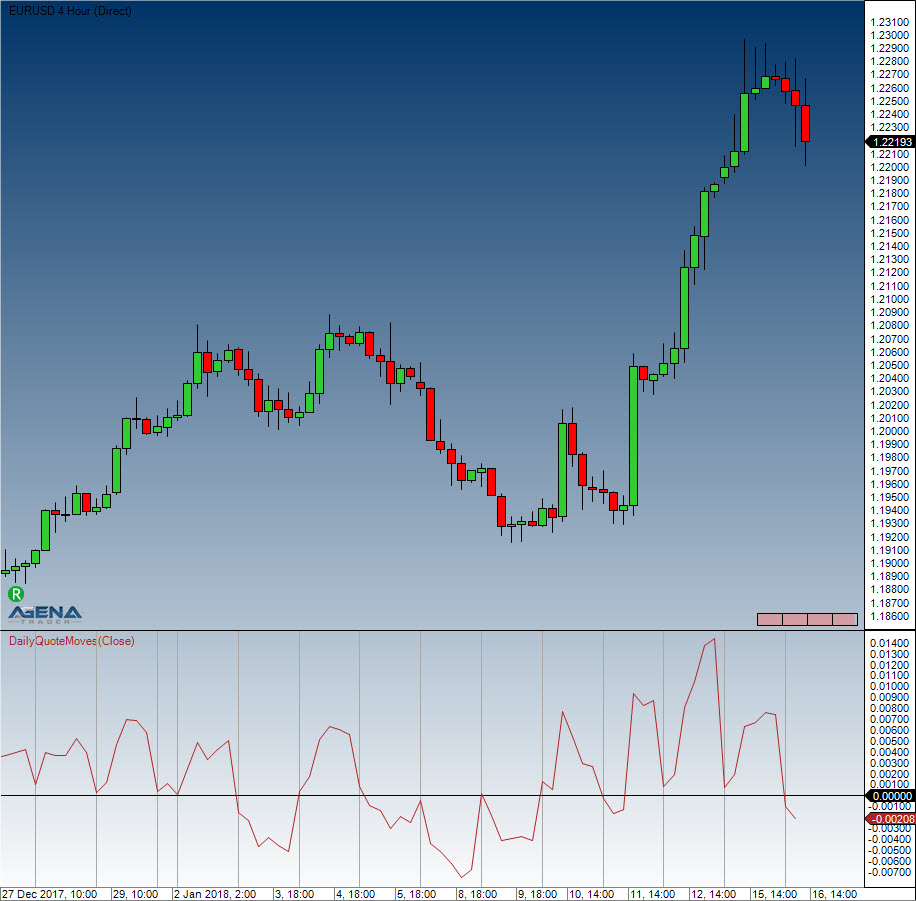
#### Description
This indicator shows the daily price moves of the current market, starting at the zero line each day. With this indicator you can see if the Market is currently over/under water based on the perspective of the market open. e.g. the FDAX has the character that after reaching the 100, 200, 400 level, the market has a potential to turn.
**Works only with intraday charts!**
#### Usage
```csharp
DailyQuoteMoves()
DailyQuoteMoves(IDataSeries inSeries)
DailyQuoteMoves()[int barsAgo]
DailyQuoteMoves(IDataSeries inSeries) [int barsAgo]
```
#### Return value
**double**
When using this method with an index (e.g. **DailyQuoteMoves**(...)\[**int** barsAgo] ), the value of the indicator will be issued for the referenced bar.
#### Parameters
inSeries Input data series for the indicator
#### Visualization
#### Example
```csharp
//How many ticks are in between closing price of current bar and opening price of the current day? If this bar is the first of the day, the difference will be shown Open-Close of the bar
DailyQuoteMoves()[0]
```