Chande Momentum Oscillator (CMO)

Description

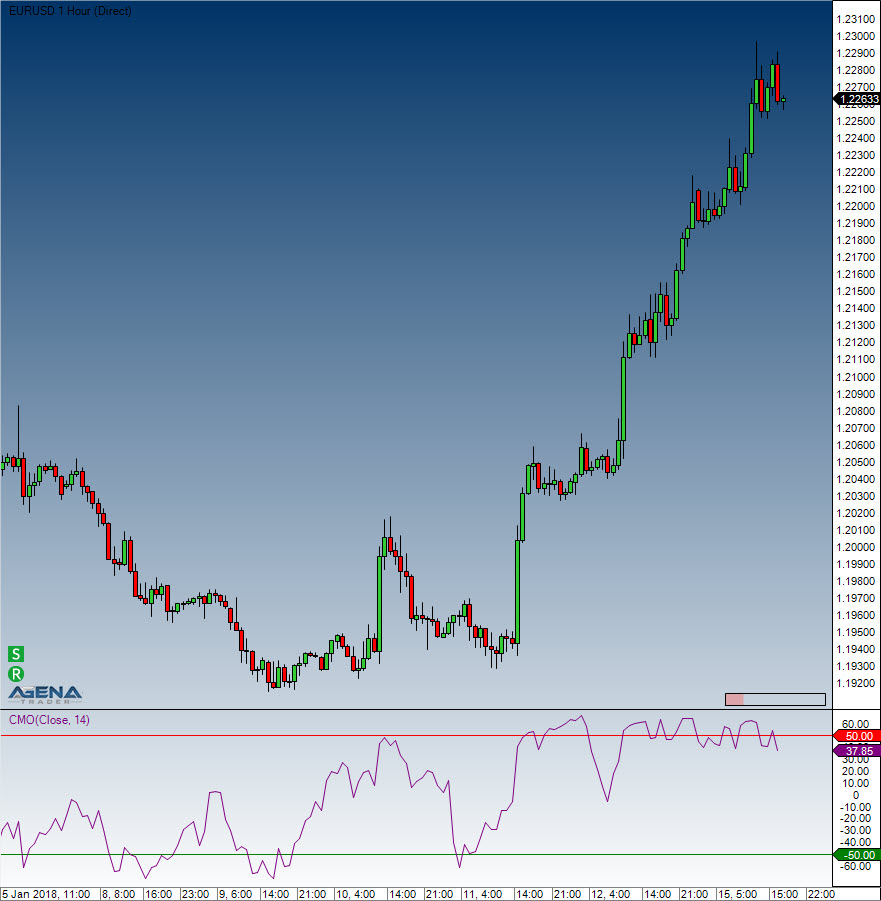
The CMO is one of several indicators created by the technical analyst Tushar Chande; it is a technical momentum indicator. This indicator arises from calculating the difference between the total of all recent gains and the total of all recent losses, and then dividing this result by the total of all price movement over the given period. This oscillator shares similarities with other momentum indicators such as the Relative Strength Index and the Stochastic Oscillator, because it is also range-bound (+100 and -100).

Interpretation

The security is deemed overbought when the momentum oscillator is above +50 and oversold when it is below -50. Many technical traders add a nine-period moving average to this oscillator to act as a signal line. Bullish signals are generated when the oscillator crosses above the signal, and bearish signals are generated when the oscillator crosses down through the signal.

Further information

http://www.boersenwissen.de/content/content_bin/cont_bin18.html

Usage

CMO(int period)
CMO(IDataSeries inSeries, int period)
CMO(int period)[int barsAgo]
CMO(IDataSeries inSeries, int period)[int barsAgo]

Return value

double

When using this method with an index (e.g. CMO(14)[int barsAgo] ), the value of the indicator will be issued for the referenced bar.

Parameters

inSeries Input data series for the indicator

period Number of bars included in the calculations

Visualization

Example

//Output for the value of the Chande Momentum Oscillator
Print("The current value for the Chande Momentum Oscillator is: " + CMO(14)[0]);

Last updated