Relative Currency Strength (RCS)
Description
The Relative Currency Strength indicator is a tool used for technical analysis for the Forex (foreign exchange) market. This indicator calculates the current and historical strength or weakness of a currency. The RCS can be used in all timeframes; the interpretation of the indicator remains the same.
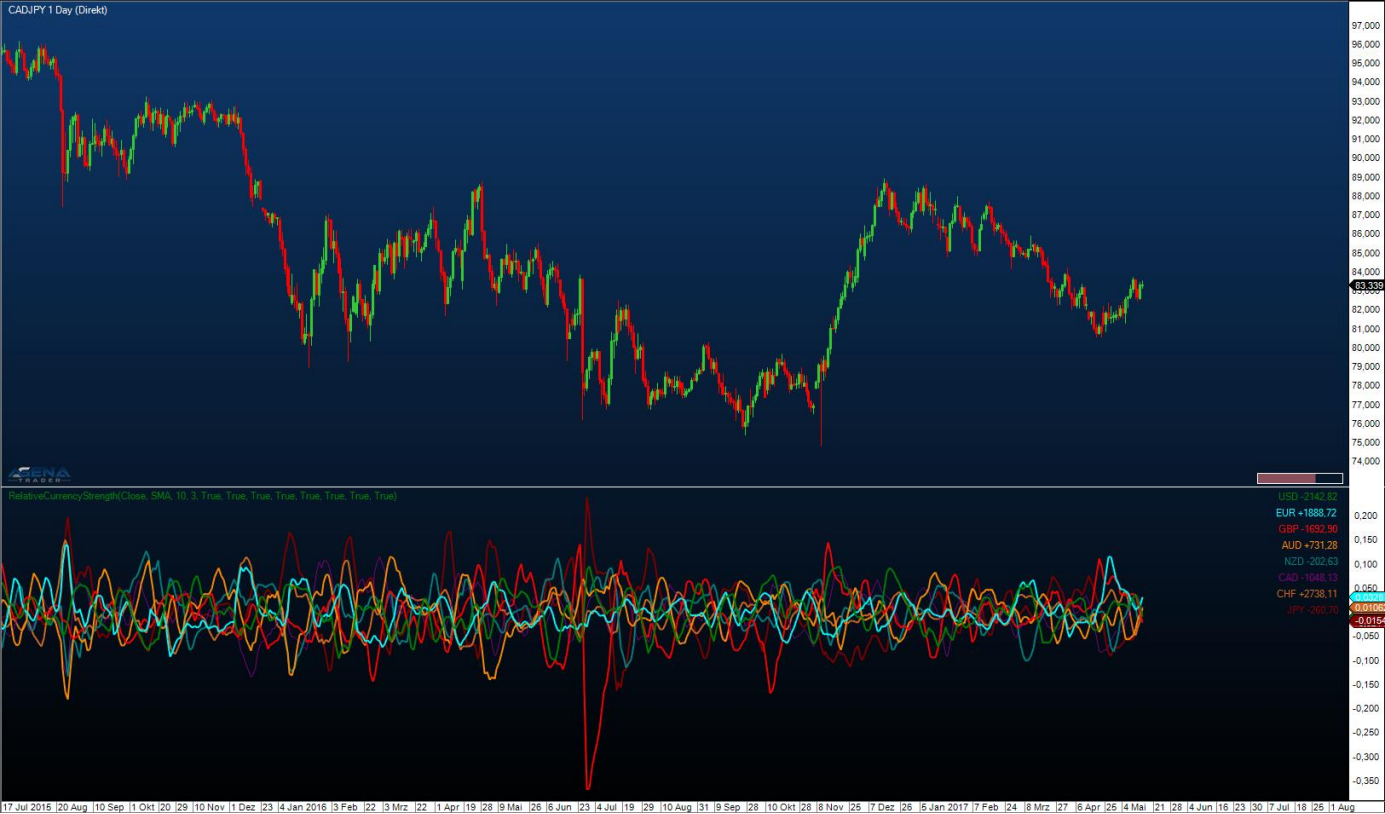
The basic idea of the RCS is based on finding the strongest and weakest currency in the present moment in a historical context. When you have all currencies displayed simultaneously, you can seek out the strongest and weakest currency in that moment. The strongest currency is the one whose line is currently the highest in comparison to the other lines; vice versa, you will find the weakest currency to be the lowest line at that moment. The currency pair that results from this is a potential trade candidate.
If the RCS is showing that at the moment, the euro is the strongest (overbought) and the US dollar is the weakest (oversold) currency relative to the other major currencies, then a short entry in the EURUSD Forex pair makes sense.
The logic behind this states that the EURUSD will fall either when the euro shows weakness or the US dollar displays strength. Since the euro is overbought, its performance will tend to weaken; in addition, the dollar is oversold, which means we can predict rising strength on the part of the USD. By finding the strongest and weakest currency, one trades the currency pair that currently contains the highest probability of a value adjustment
Parameters
Moving Average Type: [SMA/EMA] – calculation of the Relative Strength based on an SMA (Simple Moving Average) or EMA (Exponential Moving Average).
Slow Period: input parameter for the sensitivity of the calculation. Higher values mean that a slower average is used for the calculation. Please leave this parameter on the standard setting (10) unless you are 100% sure what you are changing with this, since the analysis of the RCS can be distorted by deviating values. A higher period simply outputs fewer signals, which, however, present higher potential in return.
Fast Period: see Slow Period.
– 11. Set the currencies that you wish to have displayed in the chart to “True”.
Signals
Extreme points in the valuation of 2 currencies
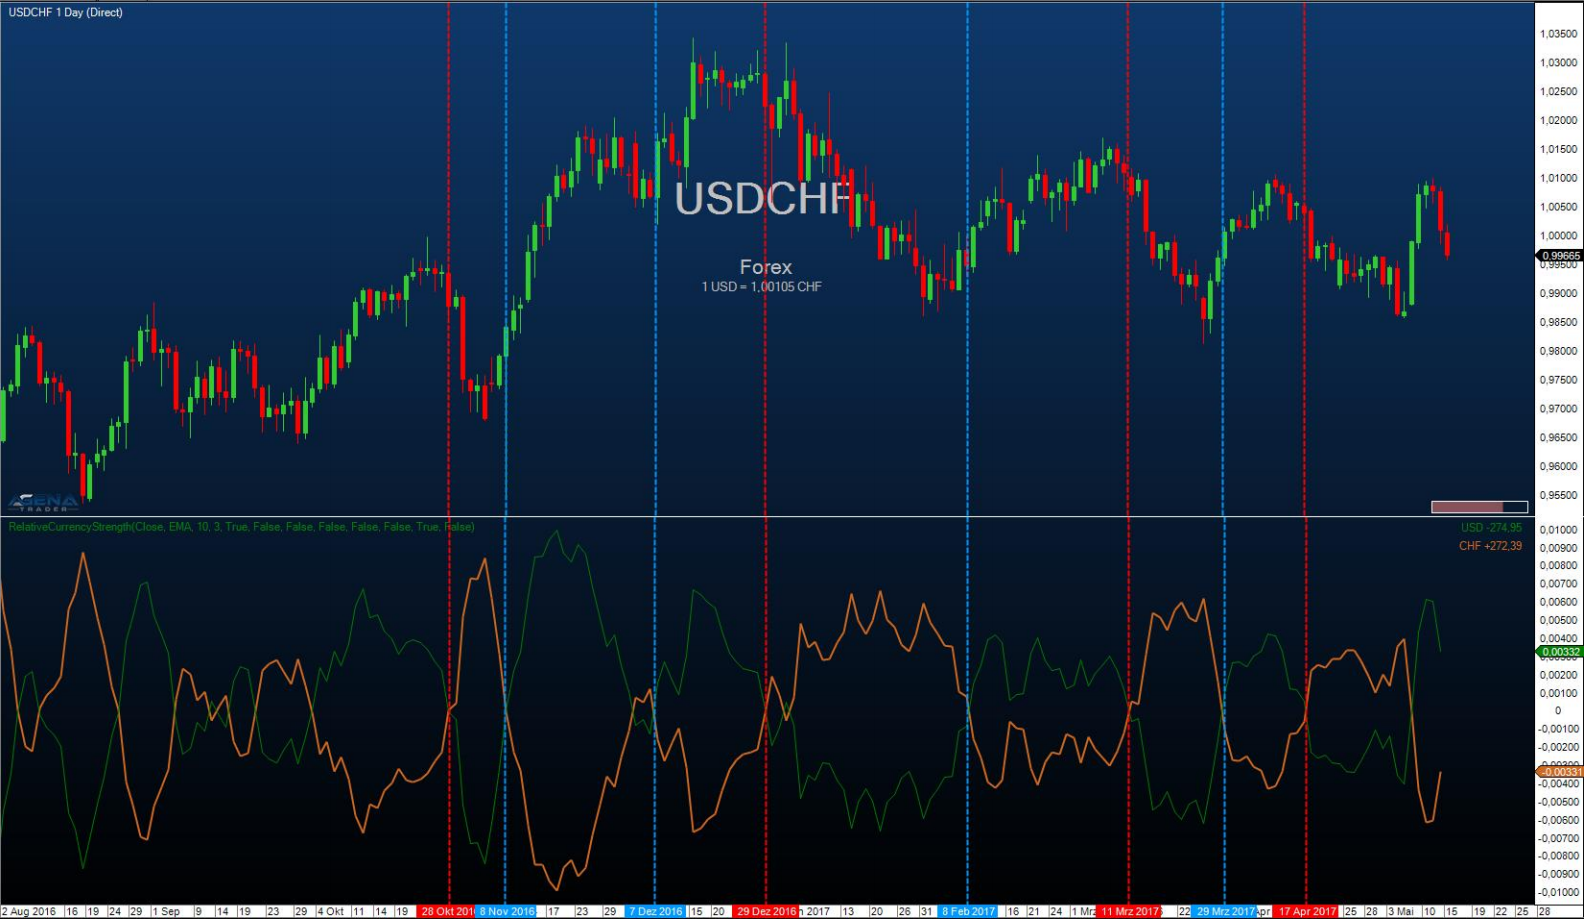
 For this signal, just display the two currencies included in the respective currency pair from the RCS. In the example above, the EURUSD is loaded in the chart and the RCS is showing the USD (green) and the euro (blue). At the red horizontal lines, there is a strong overvaluation of the euro in comparison to the dollar. In these situations, the euro shows enormous strength, and the dollar great weakness. These tendencies cannot be maintained in the long run, since in the course of things, both currencies gravitate toward their fair value. This is why this overvaluation of the euro is followed by a weakening of the EURUSD ratio, that is to say the EURUSD currency price falls. This interpretation is possible for every Forex pair.
Intersecting of the currency lines
The overlapping of two currency lines can also be used as a signal. In the example, a long signal (blue) forms when the USD intersects the CHF line from bottom to top. A short signal is formed when the CHF intersects the USD line from top to bottom.

Divergences between chart and RCS
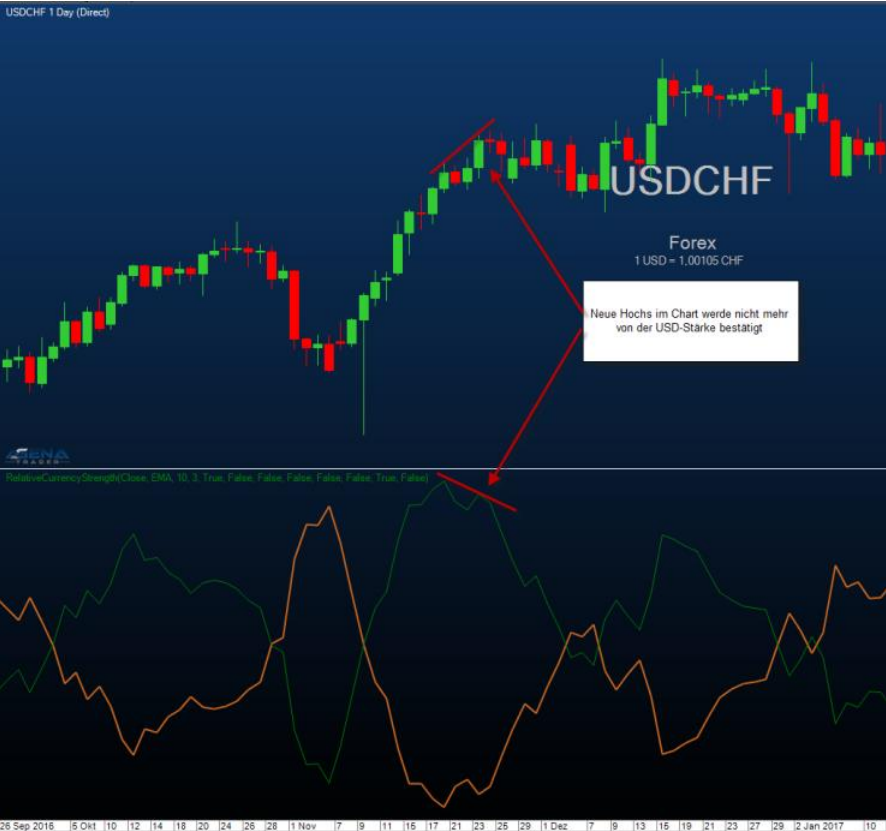
A divergence is formed when, for example, the chart forms new highs that are no longer confirmed by the strength of the RCG. In the example, the USDCHF forms new highs after a strong upward movement, which, however, are no longer confirmed by the USD strength of the RCS. After the divergence occurs, the USDCHF cannot continue its upward movement and transitions into a sideways phase. A divergence, therefore, can be used as an early indicator, for example to “foresee” the end of a longer movement.

Display of the current performance
In the right-hand side of the indicator window, you have a display showing how the currencies are currently developing. The values shown are the absolute changes of the individual currency in the RCS graph of the previous period compared to the current period. For example, a change in the USD from 0.0700 (previous period) to 0.0800 (current period) is outputted as +100 USD. This display serves to provide a global overview of how the Forex majors are currently developing relative to each other.

Last updated