> For the complete documentation index, see [llms.txt](https://indicators.agenatrader.com/llms.txt). Markdown versions of documentation pages are available by appending `.md` to page URLs; this page is available as [Markdown](https://indicators.agenatrader.com/standard-indicators/directional-movement-index-dmi.md).
# Directional Movement Index (DMI)
#### Description
Welles Wilder Jr. developed the Directional Movement concept in 1978. His concept includes the following components:
Directional Movement Index (DMI)
Average Directional Movement Index ([*ADX*](/standard-indicators/average-directional-index-adx.md))
True Range (TR)
The Directional Movement Index comes before the Average Directional Movement Index. The DMI shows the strengths of the trend-favoring price movements in percentages. Its standard application is the smoothed ADX.
#### Interpretation
The DMI shows the strength of the trend, but not the trend direction. This means that it is particularly suited as a filter for trading systems employing the Parabolic SAR, for example, in order to filter out sideways phases. When the DMI rises (especially above 25), a trend is displayed; anything below that is recognized as a sideways phase. The +DI and the –DI point towards a trend. An uptrend is classified when the +DI is above the –DI. The further apart they drift, the stronger the trend.
#### Further information
VTAD:
#### Usage
```csharp
DMI(int period)
DMI(IDataSeries inSeries, int period)
DMI(int period)[int barsAgo]
DMI(IDataSeries inSeries, int period)[int barsAgo]
```
#### Return value
**double**
When using this method with an index (e.g. **DMI**(20)\[**int** barsAgo] ), the value of the indicator will be issued for the referenced bar.
#### Parameters
inSeries Input data series for the indicator
period Number of bars included in the calculations
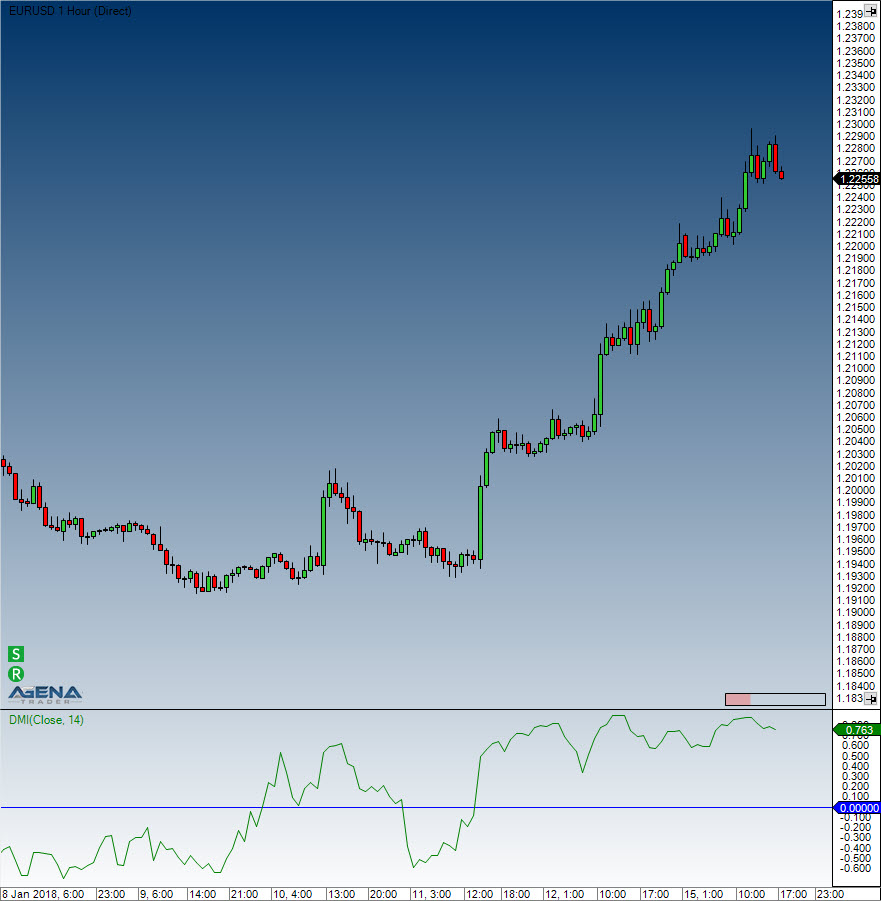
#### Visualization
#### Example
```csharp
//Output for the DMI
Print("The current DMI value is: " + DMI(20)[0]);
```