> For the complete documentation index, see [llms.txt](https://indicators.agenatrader.com/llms.txt). Markdown versions of documentation pages are available by appending `.md` to page URLs; this page is available as [Markdown](https://indicators.agenatrader.com/standard-indicators/relative-volatility-index-rvi.md).
# Relative Volatility Index (RVI)
#### Description
The Relative Volatility Index (RVI) has many similarities to the RSI indicator. Donald Dorsey developed the RVI, which uses the standard deviation instead of the daily price span. To determine the underlying volatility of the instrument, the RVI uses the standard deviation over a period of 10. The RSI indicator is then used on the results, which normalizes them. What comes from this is displayed on a scale of 1 to 100.
#### Interpretation
Values above 50 assume an increase in volatility. Values below 50 imply a drop in volatility. Dorsey recommends using the indicator as a filter for other indicators.
#### Further information
#### Usage
```csharp
RVI(int period)
RVI(IDataSeries inSeries, int period)
RVI(int period)[int barsAgo]
RVI(IDataSeries inSeries, int period)[int barsAgo]
```
#### Return value
**double**
When using this method with an index (e.g. **RVI**(14)\[**int** barsAgo] ), the value of the indicator will be issued for the referenced bar.
#### Parameters
inSeries Input data series for the indicator
period Number of bars included in the calculations
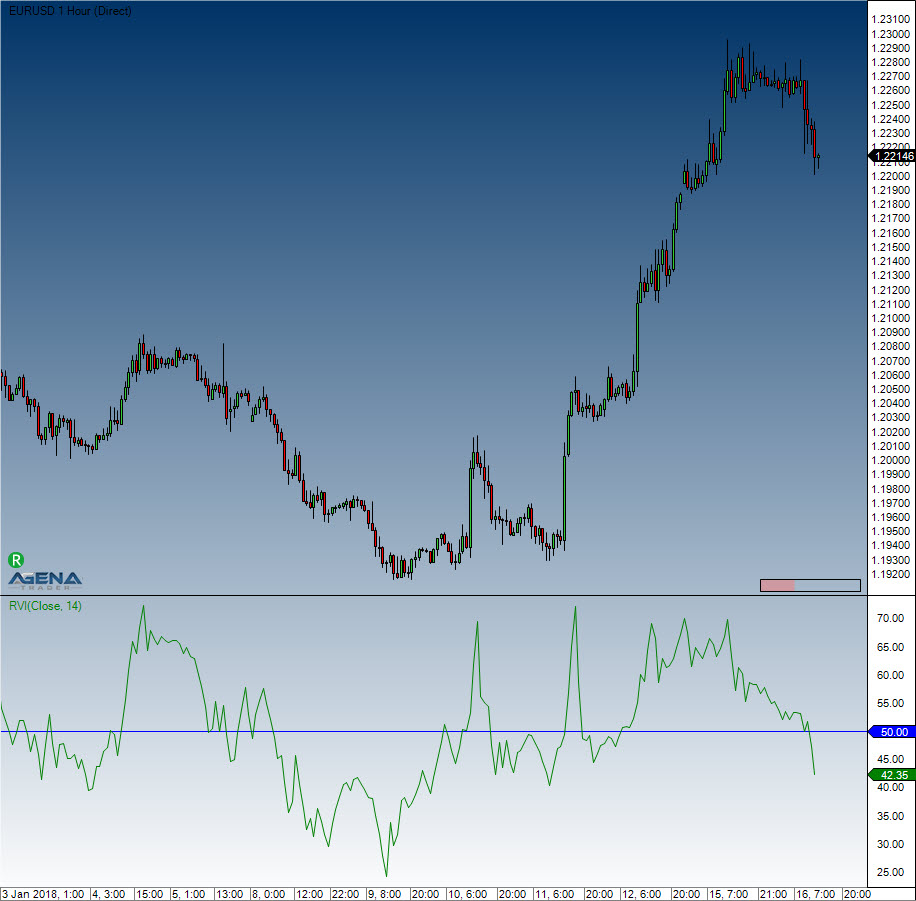
#### Visualization
#### Example
```csharp
//Output of the RVI value
Print("The current value for the RVI is: " + RVI(14)[0]);
```