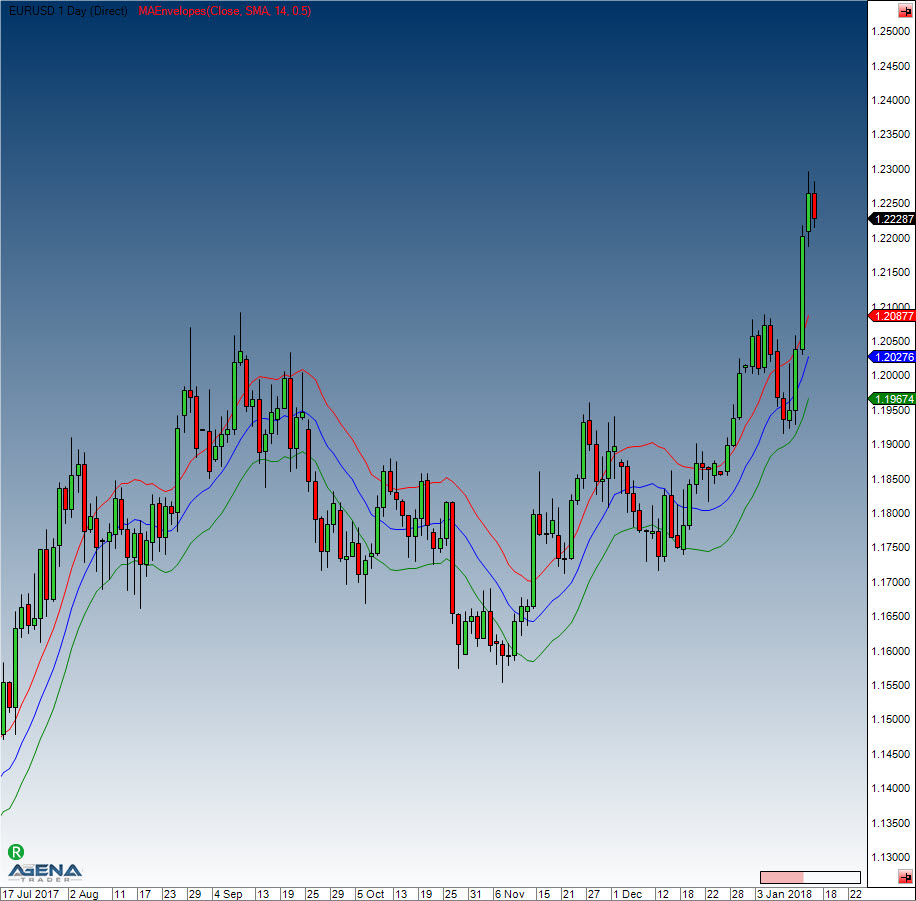
MAEnvelopes
Description
These Moving Average Envelopes are percentage-based envelopes placed above and below a moving average. The moving average forms the base for this indicator, and can be a either simple or exponential moving average. Each MA envelope is set the same percentage above or below the moving average, thereby creating parallel bands that follow price action. Moving Average Envelopes can be used as a trend-following indicator with a moving average as the base. But this indicator is not limited to just trend following: the envelopes can also be used for spotting overbought and oversold levels when the trend is relatively flat.
Indicators based on channels, bands and envelopes are intended to encompass most price action, which is why moves above or below the envelopes deserve attention. Trends often start with sharp moves in one direction – a surge above the upper envelope shows extraordinary strength, while a dive below the lower envelope exhibits extraordinary weakness. Strong moves such as these can signal the end of one trend and the start of another.
With a moving average as the foundation, Moving Average Envelopes are a trend-following indicator. As with moving averages, the envelopes lag price action. The direction of the moving average dictates the direction of the channel, so generally, when the channel moves lower, a downtrend exists, and when the channel goes higher, an uptrend is present. When the channel moves sideways, this signifies that the trend is flat.
Occasionally, it happens that a strong trend does not establish itself after an envelope break, and prices move into a trading range. Trading ranges such as these are characterized by a relatively flat moving average. These envelopes can then be used to spot overbought and oversold levels. A move above the upper envelope shows an overbought situation; a move below the lower envelope signals an oversold situation.
Usage
Return value
double
When using this method with an index (e.g. MAEnvelopes(14,SMA,1.5)[int barsAgo] ), the value of the indicator will be issued for the referenced bar.
Parameters
v Input data series for the indicator
period Number of bars included in the calculations
envelopePercentage Distance of the upper and lower bands from the middle line in percent
maType Type of moving average used, possible choices are: - EMA - HMA - SMA (default) - TMA - TEMA - WMA
Visualization
Usage
Last updated