> For the complete documentation index, see [llms.txt](https://indicators.agenatrader.com/llms.txt). Markdown versions of documentation pages are available by appending `.md` to page URLs; this page is available as [Markdown](https://indicators.agenatrader.com/standard-indicators/daily-performance.md).
# Daily Performance
#### Description
This indicator delivers information concerning the changes in the price movements based on either a past close or a current-day open in comparison to the current price level.
The Daily Performance can be displayed in points, ticks, percent, or a currency value.
Colors and other settings can be freely adjusted.
See [*Momentum*](https://agenatrader.github.io/AgenaIndicator-documentation/indicators_oscillators/#momentum), [*ROC*](https://agenatrader.github.io/AgenaIndicator-documentation/indicators_oscillators/#rate-of-change-roc).
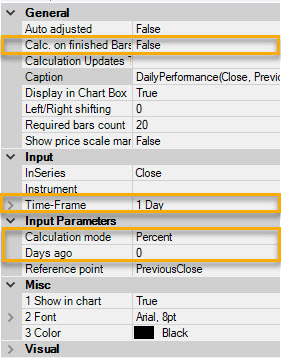
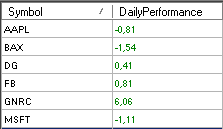
**Regarding usage with a scanner:** To get a list of your favorite stocks and their daily percentual changes, please set CalculateOnFinishedBar to “False”, TimeFrame to “1 Day”, Calculation mode to “Percent” and Days ago to “0”.
The result will look similar to this:
#### Usage
```csharp
DailyPerformance(DailyPerformanceReference reference, DailyPerformanceCalculationMode mode, int daysAgo)
DailyPerformance(IDataSeries inSeries,DailyPerformanceReference reference, DailyPerformanceCalculationMode mode, int daysAgo)
DailyPerformance(DailyPerformanceReference reference, DailyPerformanceCalculationMode mode, int daysAgo)[int barsAgo]
DailyPerformance(IDataSeries inSeries,DailyPerformanceReference reference, DailyPerformanceCalculationMode mode, int daysAgo)[int barsAgo]
```
#### Return value
**double**
When using this method with an index (e.g. **DailyPerformance**(...)\[**int** barsAgo] ), the value of the indicator will be issued for the referenced bar.
#### Parameters
inSeries Input data series for the indicator
reference Possible values are: - DailyPerformanceReference.Open - DailyPerformanceReference.PreviousClose
mode Possible values are: - DailyPerformanceCalculationMode.Points - DailyPerformanceCalculationMode.Ticks - DailyPerformanceCalculationMode.Percent - DailyPerformanceCalculationMode.Currency
daysAgo Number of days in the past
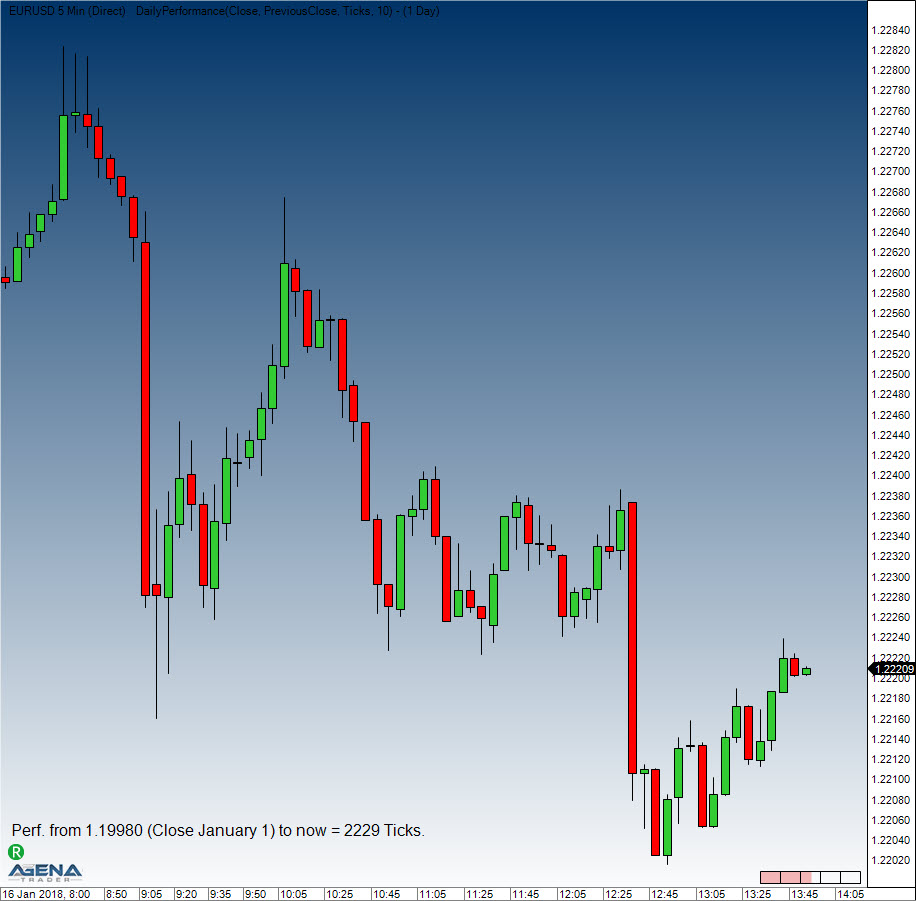
#### Visualization
#### Example
```csharp
//How many ticks are between today’s open and the current price?
DailyPerformance(DailyPerformanceReference.Open, DailyPerformanceCalculationMode.Ticks, 1)[0]
//By how much percent did the stock rise/fall since the last closing price?
DailyPerformance(DailyPerformanceReference.PreviousClose, DailyPerformanceCalculationMode.Percent, 1)[0]
//By how many points/ticks did the future deviate from the start of the trading week to the current value?
DailyPerformance(DailyPerformanceReference.PreviousClose, DailyPerformanceCalculationMode.Points, 3)[0]
//How many EURO/USD does the performance equal?
DailyPerformance(DailyPerformanceReference.PreviousClose, DailyPerformanceCalculationMode.Currency, 3)[0]
//How big is the overnight gap in comparison to the opening price?
DailyPerformance(DailyPerformanceReference.PreviousClose, DailyPerformanceCalculationMode.Points, 1)[0]
```