> For the complete documentation index, see [llms.txt](https://indicators.agenatrader.com/llms.txt). Markdown versions of documentation pages are available by appending `.md` to page URLs; this page is available as [Markdown](https://indicators.agenatrader.com/standard-indicators/volume-profile.md).
# Volume Profile
#### Description
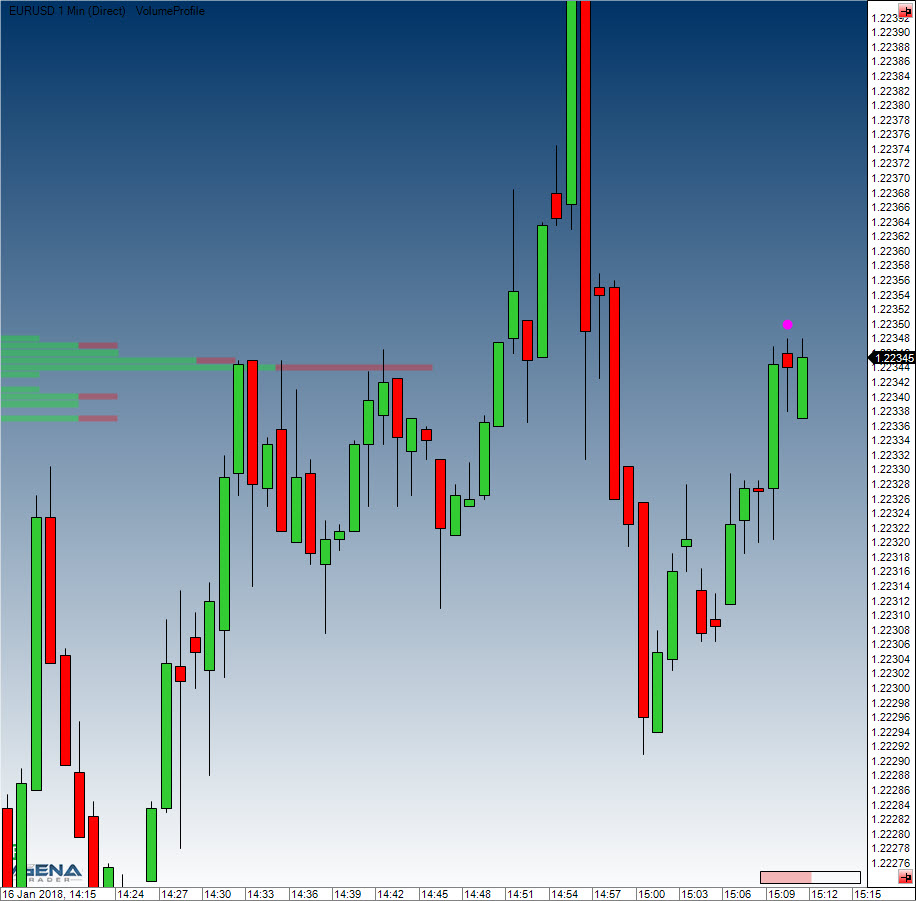
The VolumeProfile indicator displays the real-time volume profile as a vertical histogram on the chart. In this histogram, every bar depicts the cumulative traded volume for a certain price level. The starting bar for the calculations is labeled with a “#”. These bars inside the histogram have various colors: green indicates executions at or above the ask, which are interpreted as buys. Red means trades at or below the bid, which are interpreted as sells. Grey signifies neutral executions. It is important to note that the Volume Profile indicator only works together with a real-time data feed. After changes have been made in the properties window, the indicator is restarted and all values that have been calculated up to this point are lost.
See: [*VolumeZones*](https://agenatrader.github.io/AgenaIndicator-documentation/indicators_oscillators/#volumezones)
#### Interpretation
Prices with especially high trading volume will have a more satiated accumulation and distribution at their respective levels. This leads to price resistance/support zones being formed.
#### Visualization