> For the complete documentation index, see [llms.txt](https://indicators.agenatrader.com/llms.txt). Markdown versions of documentation pages are available by appending `.md` to page URLs; this page is available as [Markdown](https://indicators.agenatrader.com/standard-indicators/r-squared.md).
# R-Squared
#### Description
This indicator belongs to the linear regression series. R-Squared is the correlation coefficient that specifies the quality of the linear regression line.
It is the calculation that gives R-Squared its name – the value is the square of the correlation coefficient, which in mathematics is prefixed with the Greek letter Rho (P).
See [*Linear Regression*](https://agenatrader.github.io/AgenaIndicator-documentation/indicators_oscillators/#linearregression), [*LinRegSlope*](https://agenatrader.github.io/AgenaIndicator-documentation/indicators_oscillators/#linregslope), [*LinRegIntercept*](https://agenatrader.github.io/AgenaIndicator-documentation/indicators_oscillators/#linregintercept).
#### Interpretation
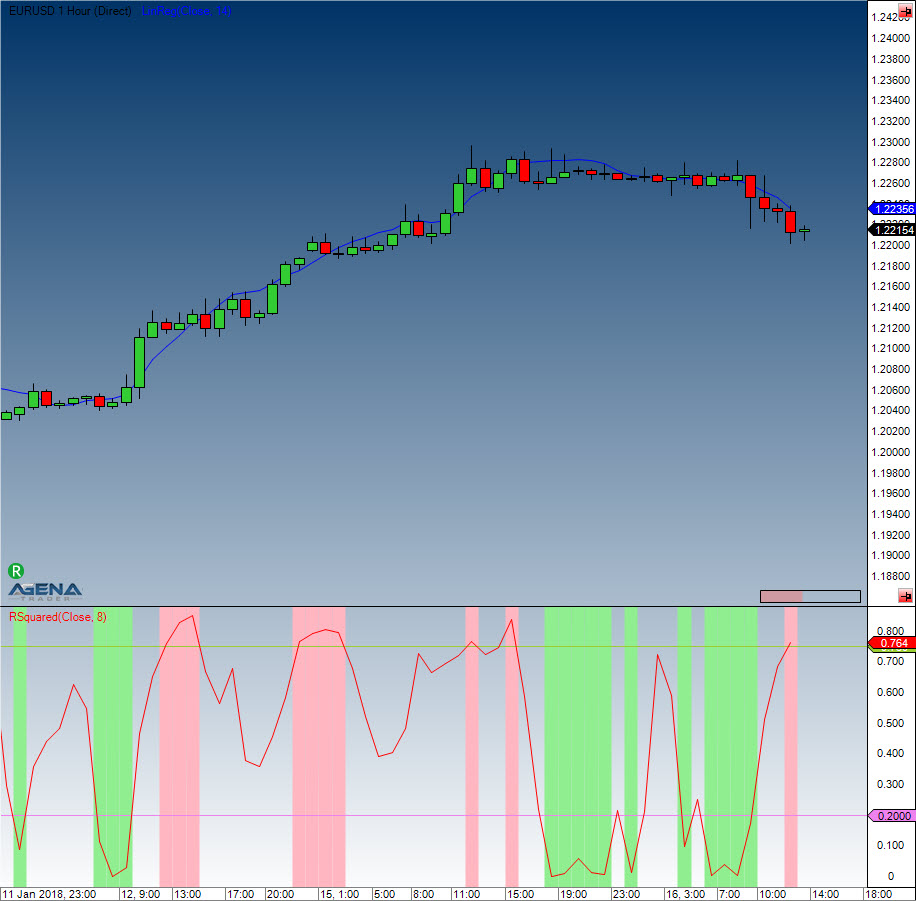
The value of the oscillator fluctuates between 0 and 1. By default, the upper boundary line is located at 0.75, and the lower border is at 0.2. If the prices are in a sideways movement, the data is scattered around the regression line. R-Squared will have a value of 0 in the aforementioned situation. In a strong trend phase, the prices will remain within a tight range for an extended period of time; if these are located close to the regression line then the R-Squared indicator will have a value of 1. Stanley Kroll and Tuchar Chande used the correlation coefficient as a trend filter in their book “*The new technical trader*”.
#### Further information
#### Usage
```csharp
RSquared(int period)
RSquared(IDataSeries inSeries, int period)
RSquared(int period)[int barsAgo]
RSquared(IDataSeries inSeries, int period)[int barsAgo]
```
#### Return value
**double**
When using this method with an index (e.g. **RSquared**(8)\[**int** barsAgo] ), the value of the indicator will be issued for the referenced bar.
#### Parameters
inSeries Input data series for the indicator
period Number of bars included in the calculations
#### Visualization
#### Example
```csharp
//Output for the value of R-Squared
Print("The current value of R-Squared is: " + RSquared(8)[0]);
```