> For the complete documentation index, see [llms.txt](https://indicators.agenatrader.com/llms.txt). Markdown versions of documentation pages are available by appending `.md` to page URLs; this page is available as [Markdown](https://indicators.agenatrader.com/premium-indicators/cot-addon/cotstockdummy.md).
# COTStockDummy
**The installation of the Technical Analysis Package is required in order to access this indicator.**
#### Description
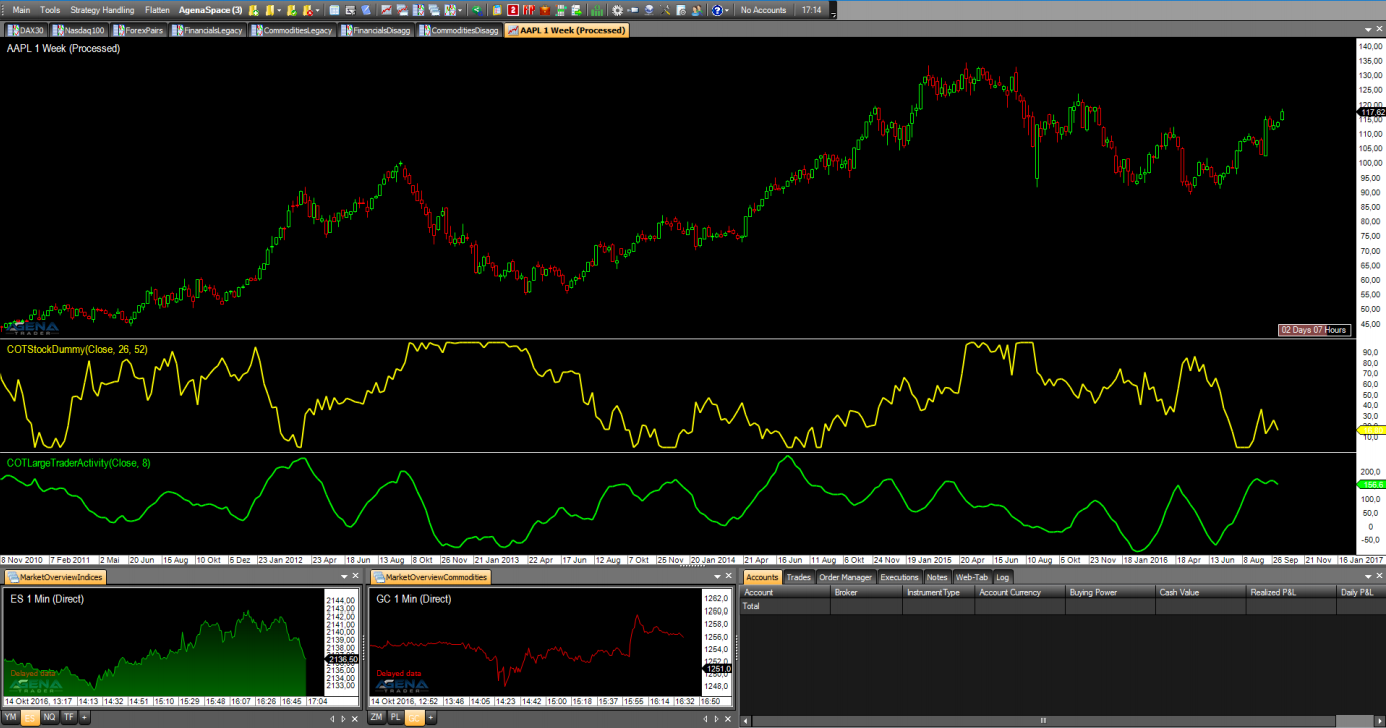
This indicator attempts to simulate the behavior of the commercials in stock markets using a special algorithm. The values are outputted as Stochastic, meaning that they oscillate between values of 0-100. The interpretation of this indicator is analogous to the interpretation of the commercial data in the standard COT indicators. The output of this indicator should be confirmed with other indicators; you must be aware that we are not talking about real COT data from market participants, but about calculations from the price data. As for the COT data, an analysis in the weekly chart is also recommended for the COTStockDummy.
The following parameters are available for the COTStockDummy:
* **ComparativePeriod:** input period for the stochastic calculation
* **Stochastic:** \[True] outputs normalized values (values between 0-100)
* **Period:** this is a period that is necessary for calculating the data. If you do not have detailed information about how this indicator works, please leave this period on the default setting.
#### Parameters
to be announced
#### Return value
to be announced
#### Usage
to be announced
#### Visualization
#### Example
to be announced