> For the complete documentation index, see [llms.txt](https://indicators.agenatrader.com/llms.txt). Markdown versions of documentation pages are available by appending `.md` to page URLs; this page is available as [Markdown](https://indicators.agenatrader.com/premium-indicators/volume-addon/volumegraph.md).
# VolumeGraph
**The installation of the Technical Analysis Package is required in order to access this indicator.**
#### Description
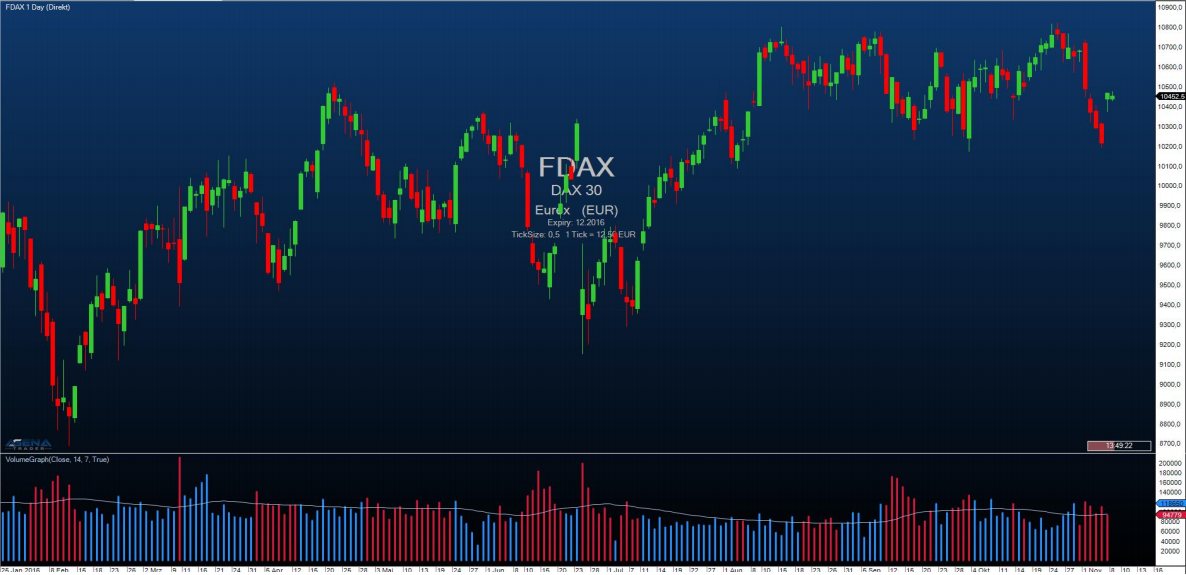
This indicator contains a normal volume histogram, but here, the coloring takes place based on price trends. The VolumeGraph determines short- or long-term price trends; you can set the sensitivity for this using the parameter “SlopeLength”. A high value delivers long-term trends; low values represent short-term price trends. Using the setting “Exponential”, you can select whether the calculation for trend determination should be based on an exponential (=True) or linear (=False) algorithm. This is about the fine-tuning, and no large changes should be expected with this parameter. In addition, the volume histogram also contains a moving average, for which you can enter the period using the parameter “AvgLength”.
#### Parameters
to be announced
#### Return value
to be announced
#### Usage
to be announced
#### Visualization
#### Example
to be announced