Indicators
HomeIndicatorsAgenaScriptRelease Notes
  • đź“’AgenaTrader Indicators Introduction
  • STANDARD INDICATORS
    • Accumulation/Distribution (ADL)
    • Adaptive Price Zone (APZ)
    • Aroon
    • Aroon Oscillator
    • Average Directional Index (ADX)
    • Average Directional Movement Rating (ADXR)
    • Average True Range (ATR)
    • BBBreakOutSpeed
    • Balance of Power (BOP)
    • Bollinger Bands
    • Bollinger Percent B (%b)
    • Bollinger Band Width (BBWidth)
    • Bollinger MTF (MultiTimeFrame)
    • BuySellPressure
    • BuySellVolume
    • CandleStickPattern
    • ChaikinMoneyFlow (CMF)
    • Chaikin Oscillator
    • ChaikinVolatility (CVL)
    • Chande Momentum Oscillator (CMO)
    • Climactic Distance
    • Commodity Channel Index (CCI)
    • Directional Movement (DM)
    • Donchian Channel
    • Directional Movement Index (DMI)
    • Double Stochastics (DSS)
    • Dynamic Momentum Index (DMIndex)
    • Ease of Movement (EOM)
    • Fisher Transform
    • Forecast Oscillator (FOSC)
    • HighestHighIndex()
    • HighestHighPrice()
    • IchimokuCloud
    • Keltner Channel
    • KeyReversalUp
    • KeyReversalDown
    • KeyReversalUpAtSMA
    • KeyReversalDownAtSMA
    • KeyReversalUpAtEMA
    • KeyReversalDownAtEMA
    • Linear Regression
    • LinRegIntercept
    • LinRegSlope
    • LowestLowIndex()
    • LowestLowPrice()
    • MACD
    • MAEnvelopes
    • Momentum (MOM)
    • Money Flow Index (MFI)
    • Moving Averages
      • DEMA - Double Exponential Moving Average
      • EMA - Exponential Moving Average
      • EMA MTF (MultiTimeFrame)
      • HMA - Hull Moving Average
      • KAMA - Kaufman's Adaptive Moving Average
      • MAMA - Mesa Adaptive Moving Average
      • SMA - Simple Moving Average
      • GapSMA - Gap Simple Moving Average
      • SMA MTF (MultiTimeFrame)
      • SMMA - Smoothed Moving Average
      • TEMA - Triple Exponential Moving Average
      • TMA - Triangular Moving Average
      • TRIX - Triple Exponential Moving Average
      • T3 - Triple Exponential Moving Average
      • VMA - Variable Moving Average
      • VWMA - Volume Weighted Moving Average
      • WMA - Weighted Moving Average
      • ZLEMA - Zero Lag Exponential Moving Average
    • nBarsUp
    • nBarsDown
    • OnBalanceVolume (OBV)
    • OutsideBars
    • Parabolic SAR
    • Percentage Price Oscillator (PPO)
    • PercentEnvelopes
    • Pivot Points
    • Polarized Fractal Efficiency (PFE)
    • Price Oscillator
    • Rainbow
    • Range
    • Range Indicator (RIND)
    • Rate of Change (ROC)
    • Relative Performance
    • Relative Spread Strength (RSS)
    • Relative Strength Index (RSI)
    • Relative Strength Levy (RSL)
    • Relative Volatility Index (RVI)
    • R-Squared
    • Standard Error (StdError)
    • Stochastics
    • Stochastics Fast
    • Stochastics RSI (StochRSI)
    • Summation (SUM)
    • SuperTrend
    • SupportResistanceAreas
    • Swing
    • Time-Series-Forecast (TSF)
    • Constant Lines
    • CurrentDayOHL
    • Daily Performance
    • DailyQuoteMoves
    • DayLines
    • GetDayBar
    • Info
    • Maximum (MAX)
    • Minimum (MIN)
    • PriceLine
    • PriorDayOHLC
    • PriorDayOHLCext
    • SessionBreakLines
    • ShowBidAsk
    • TickCounter
    • True Strength Index (TSI)
    • Ultimate Oscillator
    • Volume (VOL)
    • Volume Moving Average (VOLMA)
    • Volume Profile
    • Volume Rate of Change (VROC)
    • VolumeUpDown
    • Williams %R
    • ZigZag
  • PREMIUM INDICATORS
    • COT AddOn
      • COTLargeTraderActivity
      • COTStockDummy
      • COTReportLegacy
      • COTReportDisaggregated
      • COTOpenInterestLegacy
      • COTOpenInterestDisaggregated
      • COTCommercialIndex
      • COTAggregatedIndexPositionDisaggregated
    • DowTheory AddOn
      • DayLinesAdv
      • InsideBarsMT
      • MarketPhases
      • MarketPhases Pro
      • MTFBoxes
      • OutsideBars
      • P123
      • P123Pro
      • ReversalBars
    • Darvas AddOn
      • Darvas Boxes
    • Relative Currency Strength (RCS)
    • Volume AddOn
      • KlingerVolumeOscillator
      • Volume Oscillator
      • VolumeArea
      • VolumeGraph
      • VolumeKeltnerChannels
      • VolumeRiseFall
      • VolumeSentimentLong
      • VolumeSentimentShort
      • VolumeSessionPro
      • VolumeTickSpeed
      • VolumeUDR
      • Volume Zones
      • VolumeZoneOscillator
      • WyckoffWave
Powered by GitBook
On this page
Edit on GitLab
  1. PREMIUM INDICATORS
  2. Volume AddOn

VolumeSessionPro

Last updated 3 years ago

The installation of the Technical Analysis Package is required in order to access this indicator.

Description

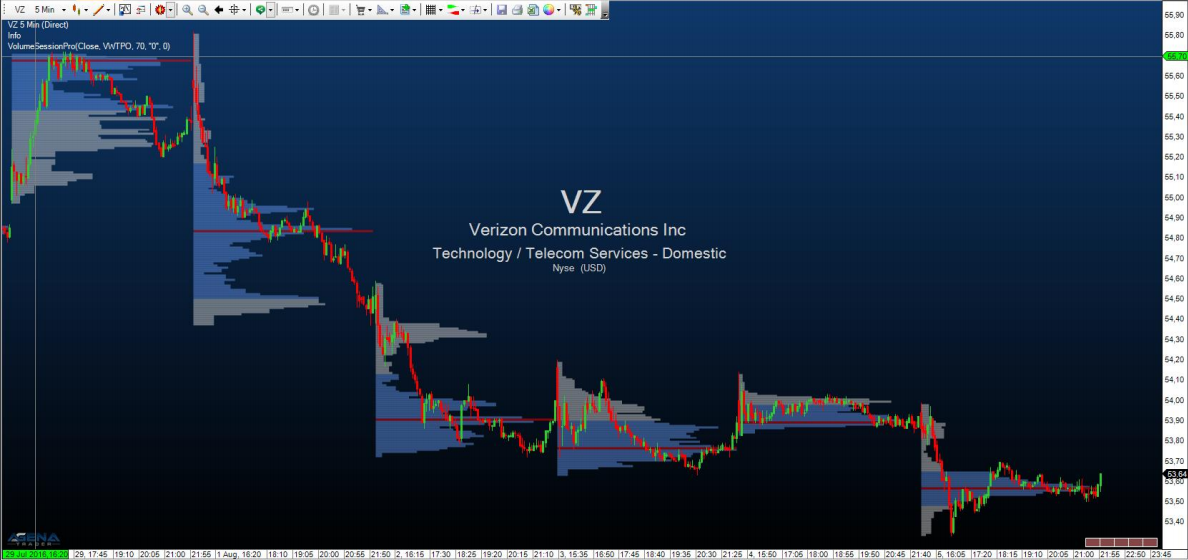
This indicator is equivalent to the well-known VolumeProfile indicator with a display for a specific time span (session). You can determine the start time and the length of a session however you wish. For each session, the VolumeProfile is then shown. Use this indicator only in timeframes smaller than 1 day; the smaller the timeframe selected, the more detailed the display of the VolumeProfile. The price at which the most volume was traded in the respective session is shown as a red bar. The price area in which, for example, 70% of the trading activity for the respective session took place, is colored light blue. You can determine this percentage yourself as you wish under the parameter “ValueArea”. Furthermore, you have four different options for displaying the volume information:

Furthermore, you have four different options for displaying the volume information:

4.1.1. VOC (Volume on close): Loads the entire volume of a bar at the closing price of this bar – e.g. if a 5-minute bar has a volume of 280 and a range of 1.5 points with a closing price at 1534.25, all 280 volume units are counted at the closing price of 1534.24.

4.1.2. TPO (Time price opportunity): This method does not take the actual traded volume into account, but instead counts an individual volume unit for each price in the traded range of the bar – e.g. if a 5-minute bar has its high at 1534 and its low at 1532.5, then one volume unit is counted for each of the following prices: 1532.50, 1532.75, 1533.0, 1533.25, 1533.50, 1533.75, and 1534.

4.1.3. VWTPO (Volume weighted time price opportunity): This version distributes the traded volume of a bar across its price range – e.g. if a 5-minute bar exhibits a volume of 280 with a range of 1.5 points, with its high at 1534 and low at 1532.5, then 40 volume units (=280/7) are added to each of the seven prices in this range: 1532.50, 1532.75, 1533.0, 1533.25, 1533.50, 1533.75, and 1534.

4.1.4. VTPO (Volume time price opportunity): Here, the traded volume is added to each price of the range – e.g. if a 5-minute bar has 280 volume units, a range of 1.5 points with a high at 1534 and low at 1532.5, then 280 volume units are added to each of the seven prices of the range:: 1532.50, 1532.75, 1533.0, 1533.25, 1533.50, 1533.75, and 1534.

Parameters

to be announced

Return value

to be announced

Usage

to be announced

Visualization

VolumeSessionPro

Example

to be announced