> For the complete documentation index, see [llms.txt](https://indicators.agenatrader.com/llms.txt). Markdown versions of documentation pages are available by appending `.md` to page URLs; this page is available as [Markdown](https://indicators.agenatrader.com/premium-indicators/darvas-addon/darvas-boxes.md).
# Darvas Boxes
#### Description
Former ballroom dancer Nicolas Darvas developed the Darvas boxes as a trading strategy in 1956. Darvas' trading technique consisted of buying into stocks that were trading at new 52-week highs, with accordingly high volumes. When a stock price rises above the previous 52-week high, but then proceeds to fall back to a price not far from that high, a Darvas box is formed. If the price falls too far, this can signify a false breakout. Otherwise, however, the lower price is used as the bottom of the box and the higher price as the top. A box is made up of an upper boundary (top) and a lower boundary (floor). Each new box is created based on a previous box, depicting a “stair” formation. If a new high is not formed after three consecutive days, then the high is labeled as the upper boundary. Following this, the floor is specified based on the lowest price.
#### Interpretation
This system is similar to a trend-following channel breakout system. As soon as one of these boxes breaks out, a new buy or sell signal is generated.
#### Explanation
The initial box top is the high of day 1. First, you should find a new high that must be higher than the high of day 1. It does not matter when the high is located - even if it is after 5 days. However, if the bottom is detected, the box has been completed. To detect the bottom, the low must be after the day 2 since the last day’s box top was detected, and should be lower than the low of the original day 1 low.
The bottom is usually detected last, and a new high may not be detected until the bottom is locked in. The Darvas box has then been completed.
If the price breaks out of the bottom or top, a new box will be started. The bottom stop loss box has been drawn as the last price percentage.
We should take the first day’s high value as the top border. The next day, we check if the high of the day is higher than the previous border top. In the case that it is higher -> top border = high. In the case that the top is going up for the last 3 steps, and the next is then lower, it will be a box top. Start looking for the bottom border. It is identical to the top (search for a trend low after which the daily low would be higher than the previous. In this case, the previous low would be the box bottom). Now we have a Darvas corridor. If one of the next bar’s high values is higher than the top box or lower than the bottom box -> box is closed (a new box will be started when the price breaks out of the top or bottom of the box).
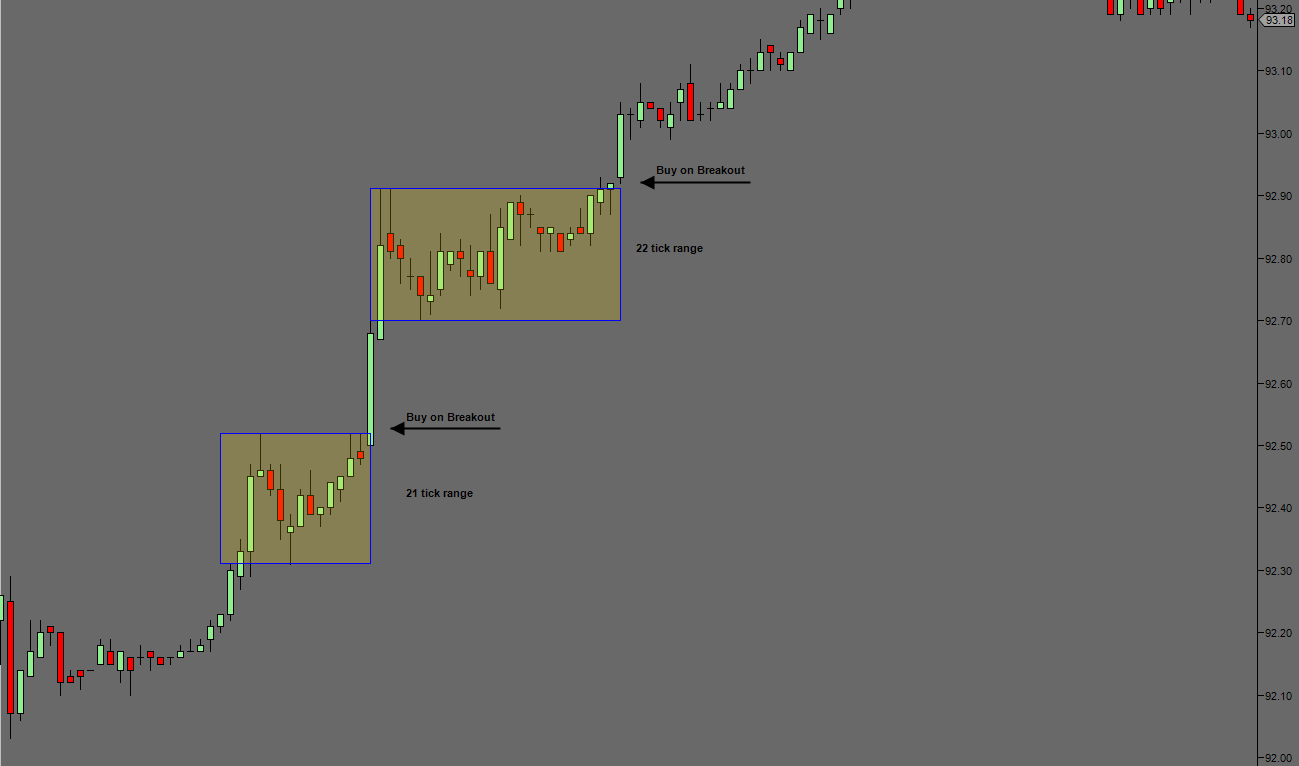
**Buy Signal**
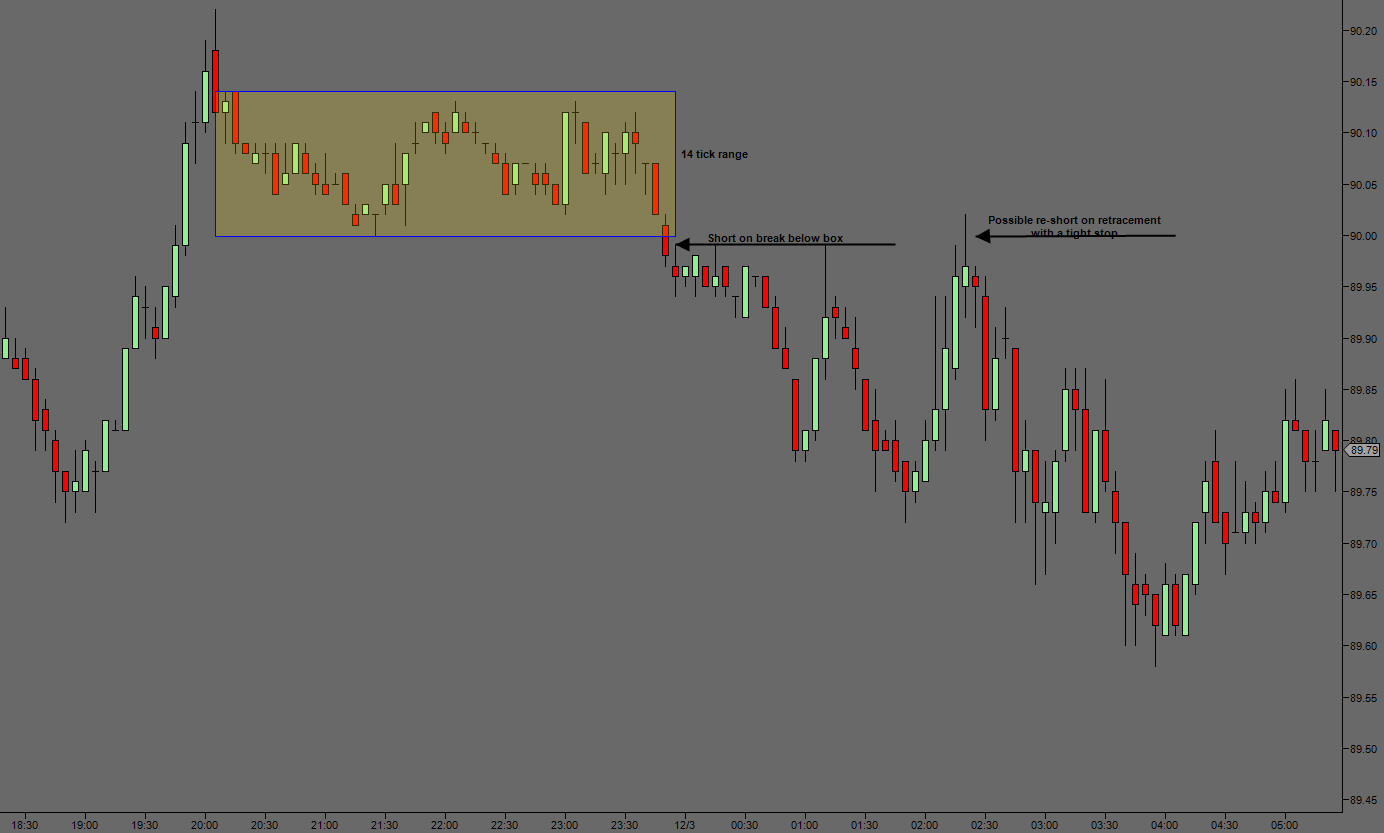
**Sell Signal**
#### Further information
Here you can read about a trading system based on the Darvas boxes. (German only)
#### Usage
```csharp
Darvas()
Darvas(IDataSeries inSeries)
//For the upper Box boundary
Darvas().Upper[int barsAgo]
Darvas(IDataSeries inSeries).Upper[int barsAgo]
//Returns the lower value
Darvas().Lower[int barsAgo]
Darvas(IDataSeries inSeries).Lower[int barsAgo]
```
#### Return value
**double**
When using this method with an index (e.g. **Darvas**()\[**int** barsAgo] ), the value of the indicator will be issued for the referenced bar.
#### Parameter
inSeries Input data series for the indicator
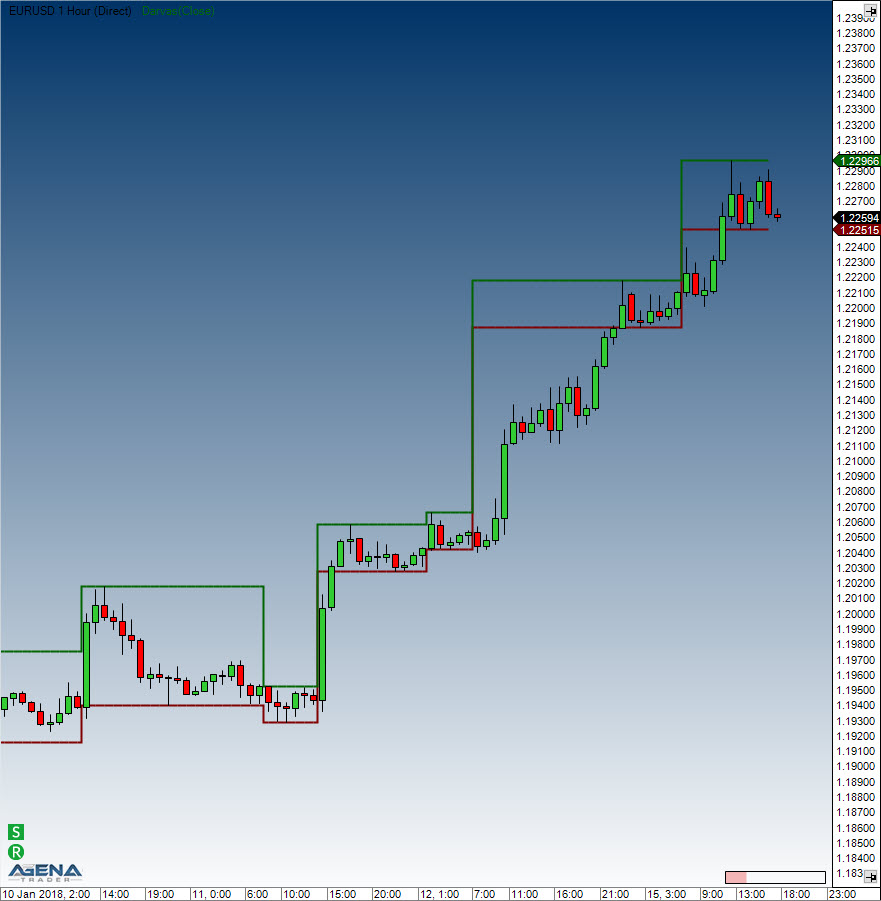
#### Visualization
#### Example
```csharp
//Output for the values for the upper markings (box top)
Print("The upper boundary for the Darvas box is: " + Darvas().Upper[0]);
//Lower markings
Print("The lower boundary for the Darvas box is: " + Darvas().Lower[0]);
```