> For the complete documentation index, see [llms.txt](https://indicators.agenatrader.com/llms.txt). Markdown versions of documentation pages are available by appending `.md` to page URLs; this page is available as [Markdown](https://indicators.agenatrader.com/standard-indicators/moving-averages/kama-kaufmans-adaptive-moving-average.md).
# KAMA - Kaufman's Adaptive Moving Average
#### Description
The KAMA is based on an EMA in which a trend efficiency ratio controls the weight of future price changes. This efficiency ratio (the squared efficiency factor) is a measure that can also be used by itself. The trend efficiency is the ratio of the absolute price change from the start to the end of the period, and the total of the absolute daily price changes. At higher trending efficiencies (i.e. straight price movements) without too much variation, the extra price carries a higher weighting, according to a shorter day period setting. Lower trending frequencies carry a smaller weighting.
#### Interpretation
Kaufman mentions that a rising KAMA value can be interpreted as a buying signal, whilst falling KAMA values assume the prices to be falling. Kaufman also defines a maximum and minimum value for the calculation of the smoothing components. The efficiency ratio is converted using specified maximum and minimum values, which are applied to newly incoming price changes. Kaufman uses 2 (short period) as a minimum value and 30 (long period) as a maximum value. The number of days for the determination of the efficiency ratio is one of the more important parameters for the KAMA.
For a more general interpretation of moving averages, please see the following chapter: [*Moving Averages*](https://agenatrader.github.io/AgenaIndicator-documentation/indicators_oscillators/#moving-averages).
#### Further information
#### Usage
```csharp
KAMA(int fast, int period, int slow)
KAMA(IDataSeries inSeries, int fast, int period, int slow)
KAMA(int fast, int period, int slow)[int barsAgo]
KAMA(IDataSeries inSeries, int fast, int period, int slow)[int barsAgo]
```
#### Return value
**double**
When using this method with an index (e.g. **KAMA**(2,10,30)\[**int** barsAgo] ), the value of the indicator will be issued for the referenced bar.
#### Parameters
inSeries Input data series for the indicator
period Number of bars included in the calculations
fast Short period
slow Long period
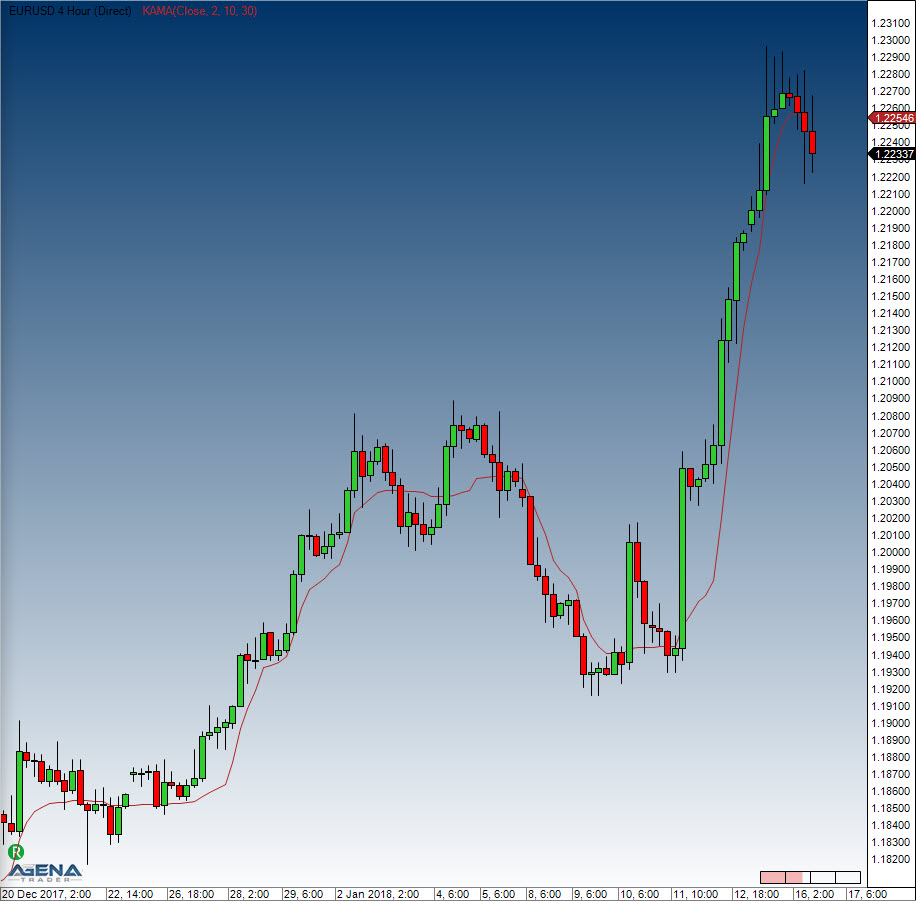
#### Visualization
#### Example
```csharp
//Output for the value of the Kaufman Moving Average(KAMA)
Print("The current value of the KAMA is " + KAMA(2,10,30)[0]);
```