Indicators
HomeIndicatorsAgenaScriptRelease Notes
  • đź“’AgenaTrader Indicators Introduction
  • STANDARD INDICATORS
    • Accumulation/Distribution (ADL)
    • Adaptive Price Zone (APZ)
    • Aroon
    • Aroon Oscillator
    • Average Directional Index (ADX)
    • Average Directional Movement Rating (ADXR)
    • Average True Range (ATR)
    • BBBreakOutSpeed
    • Balance of Power (BOP)
    • Bollinger Bands
    • Bollinger Percent B (%b)
    • Bollinger Band Width (BBWidth)
    • Bollinger MTF (MultiTimeFrame)
    • BuySellPressure
    • BuySellVolume
    • CandleStickPattern
    • ChaikinMoneyFlow (CMF)
    • Chaikin Oscillator
    • ChaikinVolatility (CVL)
    • Chande Momentum Oscillator (CMO)
    • Climactic Distance
    • Commodity Channel Index (CCI)
    • Directional Movement (DM)
    • Donchian Channel
    • Directional Movement Index (DMI)
    • Double Stochastics (DSS)
    • Dynamic Momentum Index (DMIndex)
    • Ease of Movement (EOM)
    • Fisher Transform
    • Forecast Oscillator (FOSC)
    • HighestHighIndex()
    • HighestHighPrice()
    • IchimokuCloud
    • Keltner Channel
    • KeyReversalUp
    • KeyReversalDown
    • KeyReversalUpAtSMA
    • KeyReversalDownAtSMA
    • KeyReversalUpAtEMA
    • KeyReversalDownAtEMA
    • Linear Regression
    • LinRegIntercept
    • LinRegSlope
    • LowestLowIndex()
    • LowestLowPrice()
    • MACD
    • MAEnvelopes
    • Momentum (MOM)
    • Money Flow Index (MFI)
    • Moving Averages
      • DEMA - Double Exponential Moving Average
      • EMA - Exponential Moving Average
      • EMA MTF (MultiTimeFrame)
      • HMA - Hull Moving Average
      • KAMA - Kaufman's Adaptive Moving Average
      • MAMA - Mesa Adaptive Moving Average
      • SMA - Simple Moving Average
      • GapSMA - Gap Simple Moving Average
      • SMA MTF (MultiTimeFrame)
      • SMMA - Smoothed Moving Average
      • TEMA - Triple Exponential Moving Average
      • TMA - Triangular Moving Average
      • TRIX - Triple Exponential Moving Average
      • T3 - Triple Exponential Moving Average
      • VMA - Variable Moving Average
      • VWMA - Volume Weighted Moving Average
      • WMA - Weighted Moving Average
      • ZLEMA - Zero Lag Exponential Moving Average
    • nBarsUp
    • nBarsDown
    • OnBalanceVolume (OBV)
    • OutsideBars
    • Parabolic SAR
    • Percentage Price Oscillator (PPO)
    • PercentEnvelopes
    • Pivot Points
    • Polarized Fractal Efficiency (PFE)
    • Price Oscillator
    • Rainbow
    • Range
    • Range Indicator (RIND)
    • Rate of Change (ROC)
    • Relative Performance
    • Relative Spread Strength (RSS)
    • Relative Strength Index (RSI)
    • Relative Strength Levy (RSL)
    • Relative Volatility Index (RVI)
    • R-Squared
    • Standard Error (StdError)
    • Stochastics
    • Stochastics Fast
    • Stochastics RSI (StochRSI)
    • Summation (SUM)
    • SuperTrend
    • SupportResistanceAreas
    • Swing
    • Time-Series-Forecast (TSF)
    • Constant Lines
    • CurrentDayOHL
    • Daily Performance
    • DailyQuoteMoves
    • DayLines
    • GetDayBar
    • Info
    • Maximum (MAX)
    • Minimum (MIN)
    • PriceLine
    • PriorDayOHLC
    • PriorDayOHLCext
    • SessionBreakLines
    • ShowBidAsk
    • TickCounter
    • True Strength Index (TSI)
    • Ultimate Oscillator
    • Volume (VOL)
    • Volume Moving Average (VOLMA)
    • Volume Profile
    • Volume Rate of Change (VROC)
    • VolumeUpDown
    • Williams %R
    • ZigZag
  • PREMIUM INDICATORS
    • COT AddOn
      • COTLargeTraderActivity
      • COTStockDummy
      • COTReportLegacy
      • COTReportDisaggregated
      • COTOpenInterestLegacy
      • COTOpenInterestDisaggregated
      • COTCommercialIndex
      • COTAggregatedIndexPositionDisaggregated
    • DowTheory AddOn
      • DayLinesAdv
      • InsideBarsMT
      • MarketPhases
      • MarketPhases Pro
      • MTFBoxes
      • OutsideBars
      • P123
      • P123Pro
      • ReversalBars
    • Darvas AddOn
      • Darvas Boxes
    • Relative Currency Strength (RCS)
    • Volume AddOn
      • KlingerVolumeOscillator
      • Volume Oscillator
      • VolumeArea
      • VolumeGraph
      • VolumeKeltnerChannels
      • VolumeRiseFall
      • VolumeSentimentLong
      • VolumeSentimentShort
      • VolumeSessionPro
      • VolumeTickSpeed
      • VolumeUDR
      • Volume Zones
      • VolumeZoneOscillator
      • WyckoffWave
Powered by GitBook
On this page
Edit on GitLab
  1. PREMIUM INDICATORS
  2. Volume AddOn

VolumeUDR

Last updated 3 years ago

The installation of the Technical Analysis Package is required in order to access this indicator.

Description

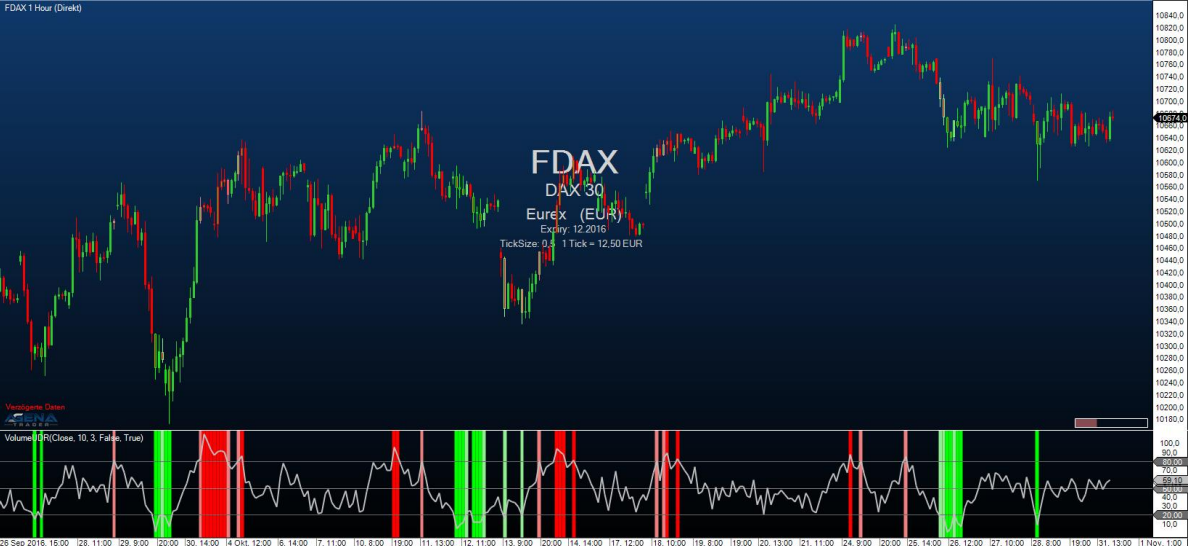
The VolumeUpDownRatio is the relationship between UpVolume and DownVolume, displayed as an oscillator. Volume is classified as UpVolume when the current close of the price candle is located above the close of the prior candle; the opposite applies for DownVolume. Values above 80 are to be graded as a bearish signal; values under 20 as a bullish signal. Besides this, a moving average can be shown, which can serve as an additional signal generator.

  • Using “DrawCandleOutline”, you can have the border of your candles colored accordingly when bullish/bearish extreme values occur.

  • PriceWeightChange regulates whether you would like to have the weighted change of the market price flow into the calculation of the indicator.

Parameters

to be announced

Return value

to be announced

Usage

to be announced

Visualization

VolumeUDR

Example

to be announced