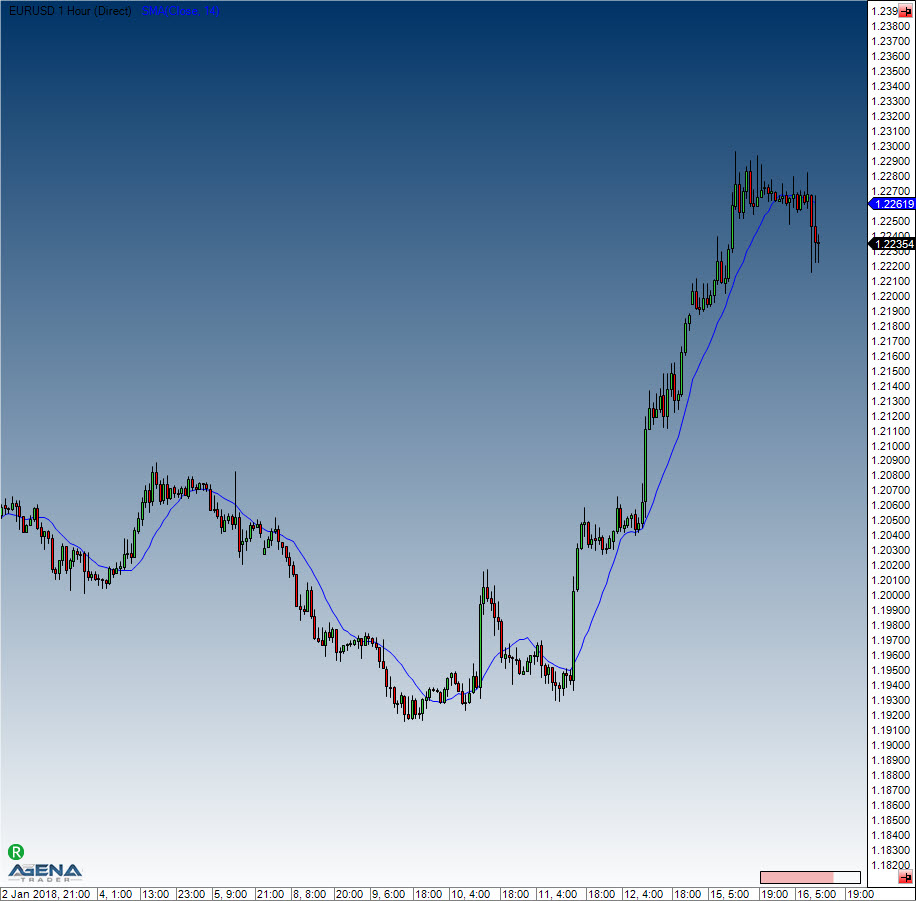
SMA - Simple Moving Average
Description
The SMA is the most well-known average, representing the simplest method of displaying the trend direction in a chart. In mathematical terms, this is the arithmetic mean of a number of individual lengths. It is called “moving” because to establish an average, the oldest value is always sacrificed to make space for the new incoming price change. Fundamentally speaking, the period length influences the intensity of the smoothing. Shorter periods (such as 10 days) will mean that the indicator follows the price changes quite closely. The SMA has a few disadvantages, which is why several adaptations of this indicator have been developed in the last few years. One of the biggest disadvantages is the fact that the indicator tends to lag, and the equal weighting for all data inputs across time intervals. You can find more general interpretations and meanings here: Moving Averages.
Further information
http://www.forex-trading-online.de/indikatoren/simple-moving-average-sma
http://vtadwiki.vtad.de/index.php/SMA#Average-Off-Berechnungsverfahren_.28MMA.29
Usage
Return value
double
When using this method with an index (e.g. SMA(14)[int barsAgo] ), the value of the indicator will be issued for the referenced bar.
Parameters
inSeries Input data series for the indicator
period Number of bars included in the calculations
Visualization
Calculation
Value.Set((last + InSeries[0] - InSeries[Period]) / Math.Min(ProcessingBarIndex, Period));
Example
Last updated